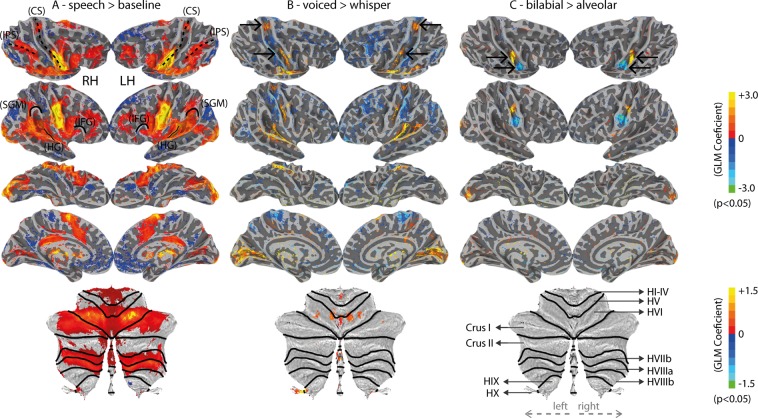
Figure 3.
Univariate fMRI results (uncorrected statistics). (A) Speech versus baseline. The central sulcus (CS), inferior parietal sulcus (IPS), supramarginal gyrus (SMG), Heschl’s gyrus (HG) and inferior frontal gyrus (IFG) are outlined to provide landmark references. Bottom: flat cerebellum map; black lines represent borders between cerebellar lobules. (B) Voiced versus whispered speech. Top arrows indicate the trunk motor area (TMA) and the bottom arrows indicate the dorsal laryngeal motor area (dLMA) found by this contrast. (C) Bilabial versus Alveolar conditions. Top arrows indicate the lip and the bottom arrows the tongue motor regions. Bottom cerebellum representation includes labels of the parcelated cerebellar lobules according to the SUIT atlas42.

