Figure 4.
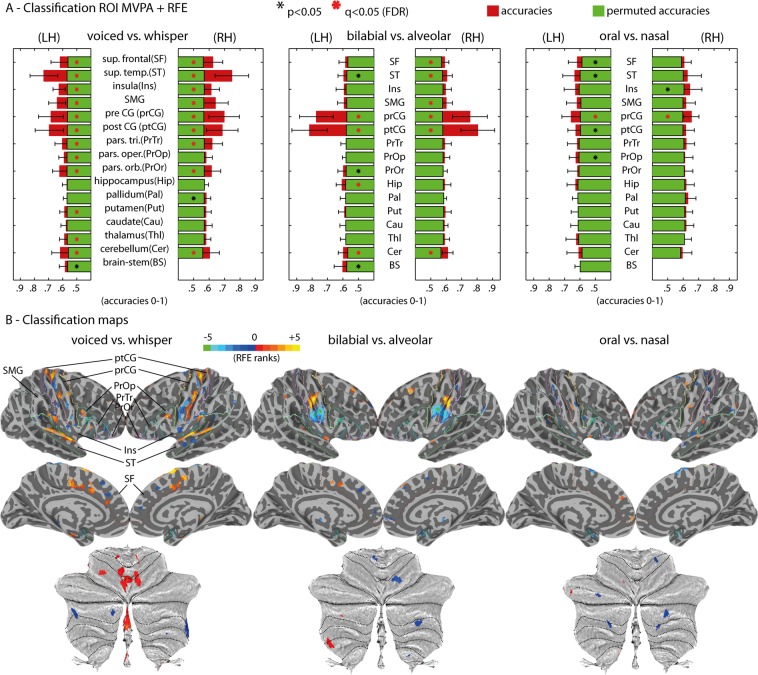
Multivariate fMRI group results. (A) MVPA ROI + RFE results for the three main contrasts: voiced versus whispered speech; bilabial versus alveolar; oral versus nasal. Classification is depicted by red bars and permutation chance-level by green bars. Black-colored asterisks (*) represent two-sided paired t-test of classification results against permutation chance-level (p < 0.05); red-colored asterisks represent FDR corrected statistics (q < 0.05) for multiple ROI tests. (B) Classification importance of the voxels within each ROI (using the RFE algorithm) projected onto the cortical and cerebellar maps. Multiple ROIs are projected simultaneously onto the maps for simplicity; the boundaries of the ROIs are indicated as colored lines and labelled in the top-left map. The sign of the voxel’s importance (positive or negative) represent their preference towards the first condition (positive values, warm colors) or second condition (negative values, cold colors). Bottom: maps of voxel’s importance in the cerebellum.

