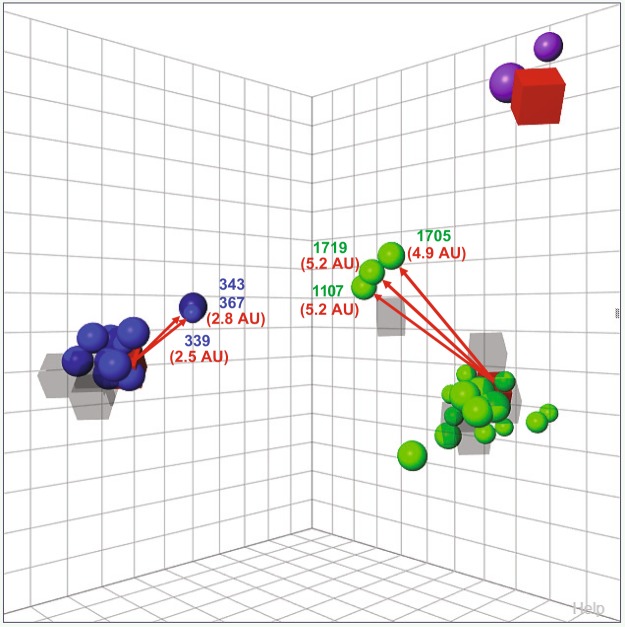
Figure 4.
Antigenic diversity of Chilean H1 swine IAVs. A three-dimensional antigenic map was constructed with cross-HI titers among ChH1A, H1ChB and A(H1N1)pdm09-like strains. All axes represent antigenic distance, and the orientation of the map within these axes is free. The spacing between grid lines is 1 unit of antigenic distance (antigenic unit or AU), corresponding to a 2-fold dilution of antiserum in the HI assay. Circles correspond to viruses and squares to antisera analyzed. Antigenic clusters were defined by Ward’s method based on the Euclidean distances among strains. Color represents the antigenic clusters: ChH1A is blue, ChH1B is purple, and A(H1N1)pdm09-like is green. The antisera from the strains A/swine/Chile/VN1401-274/2014(H1N2), A/swine/Chile/VN1401-4/2014(H1N2) and A/swine/Valparaiso/VN1401-559/2014(H1N1), highlighted as a red square, had the broadest cross-reactivity and, therefore, they were the nearest antisera to the center of the antigenic clusters ChH1A, ChH1B and A(H1N1)pdm09-like, respectively. Values in AU and red arrows show the distance between these central antisera and the outlying antigens (antigenic variants) in each cluster: A/swine/Chile/VN1401-339/2014(H1N2) (339), A/swine/Chile/VN1401-343/2014(H1N2) (343) and A/swine/Chile/VN1401-367/2014(H1N2) (367) from ChH1A, and A/swine/Rancagua/VN1401-1107/2015(H1N1) (1107), A/swine/Chillan/VN1401-1705/2015(H1N1) (1705) and A/swine/Chillan/VN1401-1719/2015(H1N1) (1719) from A(H1N1)pdm09-like.

