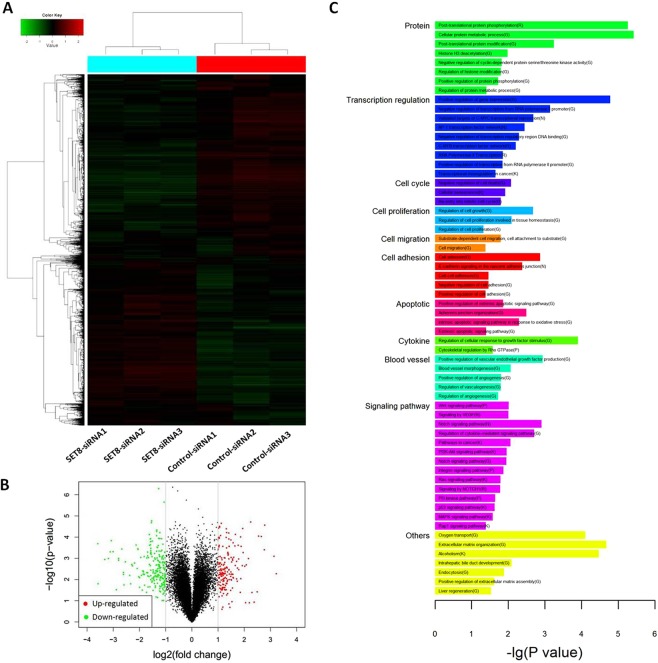
Figure 4.
Gene expression profiling revealed the genome-wide influence of SET8- siRNA on SMMC-7721 cells. (A) Heat map analysis of differentially expressed genes in SET8-siRNA and control-siRNA treated cells. Up-regulated and down-regulated genes are shown in red and green, respectively. (B) Volcano plot showing the expression of genes in SET8-siRNA and control-siRNA treated cells. Red dots indicate a > 2.0-fold change in mRNA between SET8-siRNA and control-siRNA cells. Green dots indicate a < −2-fold change between SET8-siRNA and control-siRNA cells. (C) Reactome FI analysis with 406 genes with significantly altered expression upon SET8 knockdown. ‘G’ represents ‘GO biological process’, ‘K’ represents ‘KEGG pathway’, ‘N’ represents ‘NCI PID’, ‘R’ represents ‘Reactome’, ‘P’ represents ‘Reactome Pathway’ and ‘B’ represents ‘BioCarta’. The detailed results are shown in Supplementary Table S2.

