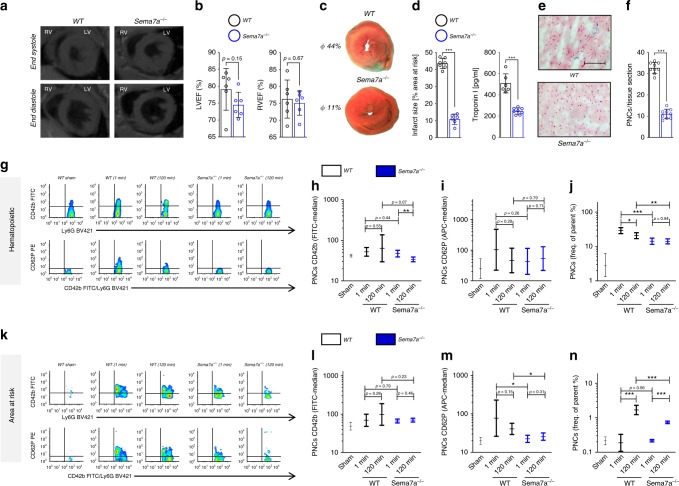
Fig. 3. Sema7a−/− animals show reduced signs of MIRI and attenuated PNC formation.
a Sema7a−/− animals and littermate controls were evaluated by magnetic resonance tomography (MRT) to exclude anatomical and functional alterations in Sema7a−/− animals (n = 6/group). b Left and right ventricular ejection fraction (LVEF or RVEF in %) determined through MRT (n = 6/group). c Sema7a−/− mice and littermate controls were exposed to 60 min of ischemia and 120 min of reperfusion with samples taken after 1 or 120 min of reperfusion. Representative TTC-stained slices of myocardial tissue showing infarcted area (blue/dark = retrograde Evans blue staining; red and white = AAR, white = infarcted tissue, 120 min) with d systematic evaluation of infarct sizes (n = 7;6) and corresponding troponin I plasma levels (n = 6;8). e Representative histological sections (scale bar 100 µm) of Sema7a−/− and littermate control hearts (120 min). f Number of PNCs in myocardial tissue sections in AAR of Sema7a−/− mice and littermate controls (120 min, n = 9/group). g Representative flow-cytometric plots of PNCs in the blood of Sema7a−/− and littermate controls, showing GPIb (CD42b) and P-selectin (CD62P) after 1 and 120 min reperfusion. Mean fluorescence intensity (MFI) for h GPIb (CD42b, n = 6;7;7;7;7) and i P-selectin (CD62P, n = 7/group) in PNCs and j systematic evaluation of PNCs in % by flow cytometry in the blood of Sema7a−/− animals and littermate controls (n = 7/group). k Representative flow-cytometric plots of PNCs in the AAR and MFI for l GPIb (CD42b, n = 7;7;7;7;6) and m P-selectin (CD62P, n = 7;6;7;7;7) and n systematic evaluation of PNCs by flow cytometry in % in the AAR of WTs and Sema7a−/− animals at 1 min and 120 min (n = 6;7;7;7;7). Comparisons in b, d, f were analyzed by unpaired two-tailed Student’s t-tests (data are mean ± SD). For h–j, l–n we used log transformation of data to conform normality. For log-transformed data, unpaired two-tailed Student’s t-tests were performed on the log values and results are displayed as geometric means and their 95% confidence intervals. *p < 0.05, **p < 0.01, and ***p < 0.001 as indicated.

