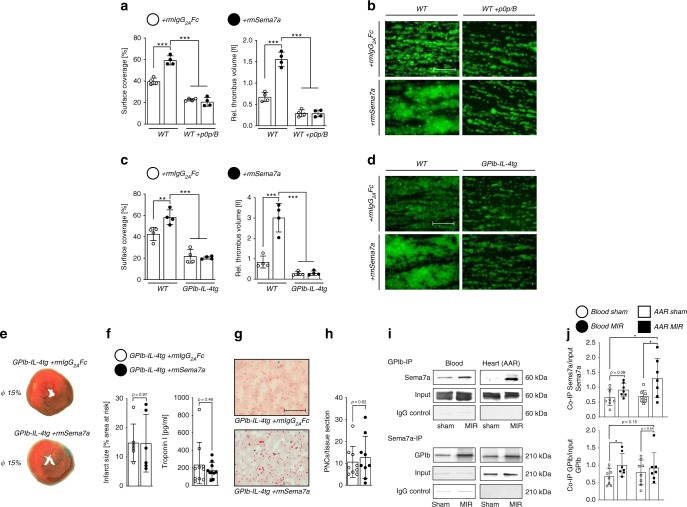
Fig. 5. Sema7a exerts its function through platelet glycoprotein Ib (GPIb).
a rmSema7a markedly enhances adhesion and thrombus formation of WT platelets on collagen under flow at a shear rate of 1000 s–1. Blockade of the ligand-binding site of platelet GPIb (p0p/B) abolishes this thrombus-promoting effect of rmSema7a (n = 4/group). b Representative IF images (scale bar 50 µm) of the experiment in a. c rmSema7a does not affect adhesion or thrombus formation of GPIb-IL-4-tg platelets on collagen under flow at a shear rate of 1000 s−1 (n = 4/group). d Representative IF images (scale bar 50 µm) of the experiment in c. The representative fluorescence images as well as the mean surface coverage and relative thrombus volume are shown, as measured by integrated fluorescence intensity (IFI) per mm2. e GP-Ib-IL-4-tg animals were exposed to 60 min of ischemia and 120 min of reperfusion. They were injected with rmSema7a or rmIgG2A Fc control right before ischemia. f Infarct sizes (n = 6/group) and correlating troponin I plasma levels were determined (n = 10/group). g Representative histology sections (scale bar 100 µm) and h number of PNCs counted from myocardial tissue sections of GP-Ib-IL-4-tg injected with either rmSema7a or rmIgG2A Fc (control, n = 9/group). i Co-immunoprecipitation analysis was performed between Sema7a and GPIb in blood and heart (AAR) tissue. Sema7a was affinity-precipitated using anti-GPIb antibody, and GPIb was affinity-precipitated using Sema7a antibody. As a negative control, rat or mouse IgG was used. Bound proteins were analyzed by immunoblotting. The same protein quantity was applied in all input loadings of blood or heart lysates. j Densitometric analysis was performed to quantify the immunoblots (data are mean ± SD; n = 8;7;8;7). In a, c we performed one-way analyzes of variance followed by Dunnett’s tests to group WT +rmSema7a (data are mean ± SD). Comparisons in f, h, and j were analyzed by unpaired two-tailed Student’s t-tests (data are mean ± SD). *p < 0.05, **p < 0.01, and ***p < 0.001 as indicated.

