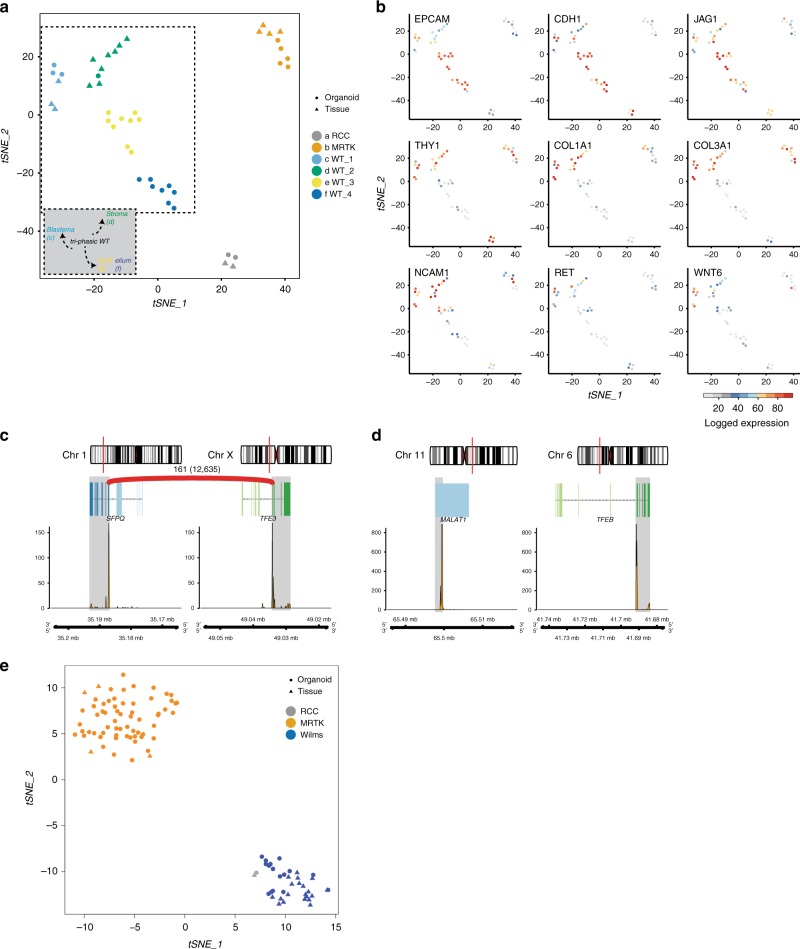
Fig. 5. Transcriptome and DNA methylation profiling of paediatric kidney cancer organoids.
a t-SNE representation of unsupervised graph-based clustering of paediatric kidney cancer organoids and tissues gene expression profiles, demonstrating a disease-based separation for the three main tumour types (RCC, MRTK and Wilms tumour) and a composition-based separation for the most prevalent one, Wilms tumour. b t-SNE maps, as in a, showing the colour-coded logged expression levels of several markers used in the clinic or separating the different populations. c, d Depicted are fusion transcripts detected in tRCC-derived organoids 107T (c) and 71T (d) with their chromosomal location and exon structure and a schematic representation of the fusion breakpoint. Coverage track of the fusion genes is included at the bottom, indicating RNA expression levels. The number above the red arc represents the sequencing reads that support the fusion event. e t-SNE analysis was performed using the top 2000 most variably methylated CpG sites in paediatric kidney cancer organoids and tissues, and revealed that organoids cluster with the tumour entity they were derived from.

