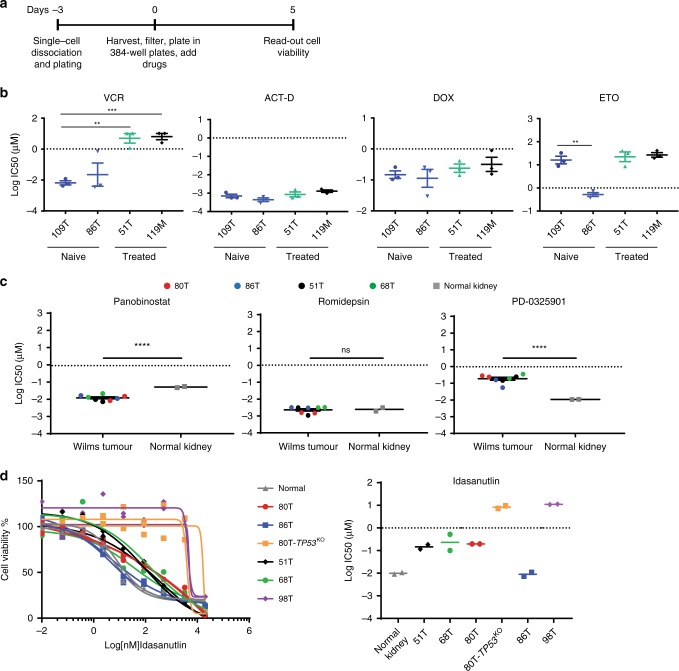
Fig. 6. Organoid drug screens reveal patient-specific drug sensitivities.
a Schematic overview of the organoid drug treatment experiment. b Graphs show the average IC50 values of vincristine (VCR), actinomycin D (ACT-D), doxorubicin (DOX) and etoposide (ETO) in the indicated Wilms tumour organoid lines. In case the IC50 value was not reached (see Supplementary Fig. 12a), the highest tested concentration was used for the calculations. Error bars represent SEM of three independent experiments (each individual experiment includes technical quadruplicates). P-values were calculated using a two-tailed Student’s t test, two-sided: **<0.01, ***<0.001. P-value VCR: 119 M vs 109T = 0.0005; 109T vs 51T = 0.0049. P-value ETO: 109T vs 86T = 0.0044. c Average IC50 values of romidepsin, panobinostat and PD0325901 in the indicated Wilms tumour and normal kidney organoid cultures. Each dot/square (two per organoid culture) represents the average of technical quadruplicates of an individual organoid culture. P-values were calculated using a two-tailed Student’s t test, two-sided: ****<0.0001. P-value Romidepsin: Wilms tumour vs normal kidney = 0.8339. d Dose–response curves (left) and average IC50 (right) of Idasanutlin on the indicated Wilms tumour and normal kidney organoid cultures. As control for P53 function, 80T-TP53KO organoids were included, thereby demonstrating that anaplastic Wilms tumour-derived organoids (98T) are less sensitive to Idasanutlin treatment. Curves with the same colour represent independent experiments. Each individual point represents the average of quadruplicate measurements. Source data are provided as a Source Data file.

