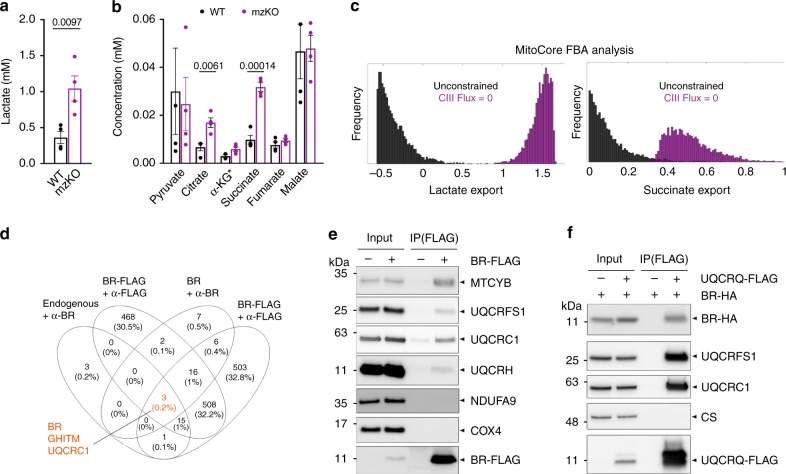
Fig. 5. Br functionally and physically interacts with electron transport chain complex III.
a Lactate concentrations in 5 dpf WT and mzKO larvae. Data represent mean and SEM of four independent clutches each with 50 larvae per genotype. p-values from two-sided paired t-test. b Citric acid cycle organic acid concentrations in 5 dpf WT and mzKO larvae. Data represent mean and SEM of four independent clutches each with 50 larvae per genotype. p-values from two-sided paired t-test with Bonferroni correction. *α-KG concentrations are a 10-fold multiple to enable visualization on the same scale. c Distributions of the export rate of lactate and succinate (5000 flux samples) comparing the unconstrained MitoCore model versus the CIII-blocked model derived by MitoCore flux balance analysis (FBA). d Venn diagram depicting intersections of proteins identified in 4 co-IP/mass spec experiments of BR in HEK293T mitochondria. Endogenous BR and overexpressed untagged BR were immunoprecipitated with α-BR, overexpressed BR-FLAG with α-FLAG. e Immunoprecipitation of BR-FLAG followed by immunoblotting for indicated ETC proteins from mouse mitochondria with AAV9-mediated expression of BR-FLAG. MTCYB, UQCRFS1, UQCRC1, and UQCRH are components of CIII. NDUFA9 and COX4 are components of CI and CIV, respectively. f. Reciprocal IP of BR with CIII components. UQCRQ-FLAG and BR-HA were co-transfected into HEK293T. UQCRQ-FLAG immunoprecipitation was followed by immunoblotting for BR-HA and indicated proteins. CS is an unrelated matrix protein.

