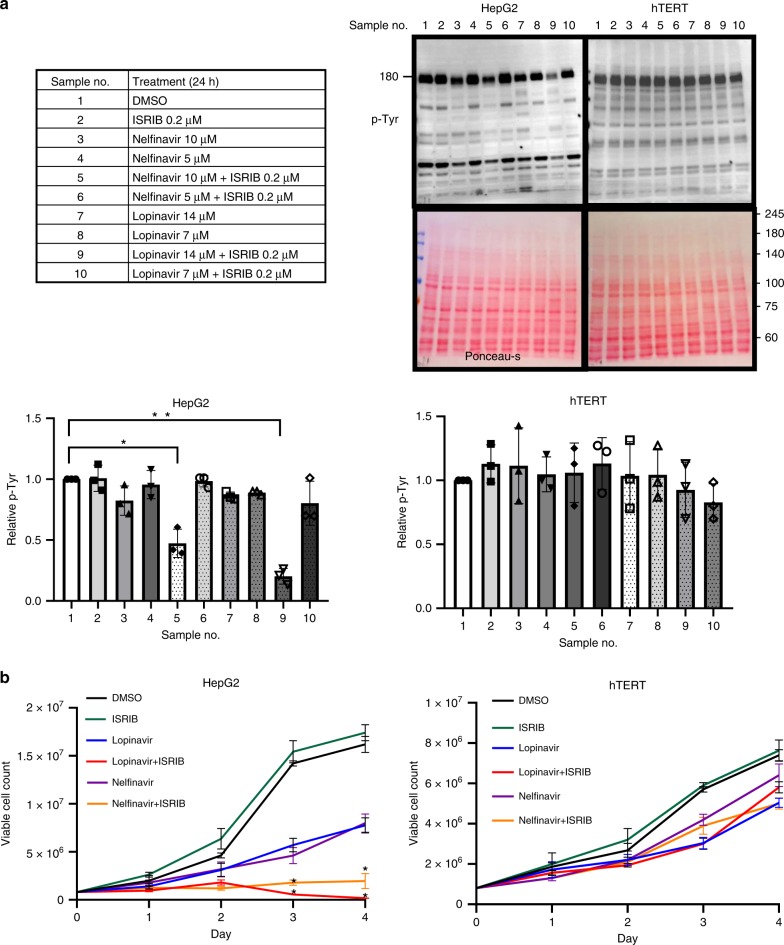
Fig. 5. The combination between lopinavir or nelfinavir with ISRIB elicits sERr, reduces total P-Tyr levels and compromises growth of HepG2, less of hTERT cells.
a Immunoblotting for P-Tyr and ponceau-s staining of HepG2 cells and of hTERT treated with DMSO, nelfinavir, lopinavir, and ISRIB as specified in the table (left). Quantification of total P-Tyr relative to ponceau-s is shown in bar graphs (right) for both experiments. Average of three independent experiments ± SD. *p > 0.05, **p < 0.01, Kruskal–Wallis one-way analysis of variance. b Monitoring of proliferation evaluation of HepG2 and hTERT cells treated with DMSO, ISRIB (0.2 μM), nelfinavir (14 μM) (top-left), and lopinavir (14 μM) (top-right) alone or in combination. Data are shown as viable cell count (VCC) vs. time (days) conducted in triplicates for each treatment. Error bars represent S.E.M. Statistical significance was calculated for each combined treatment relative to drug only. *p > 0.05 were calculated using Student’s t test (two-tailed).

