
Fig. 5. Quantification of Ub and UbKEKS in lamin A and lamin B2 pulldown assay.
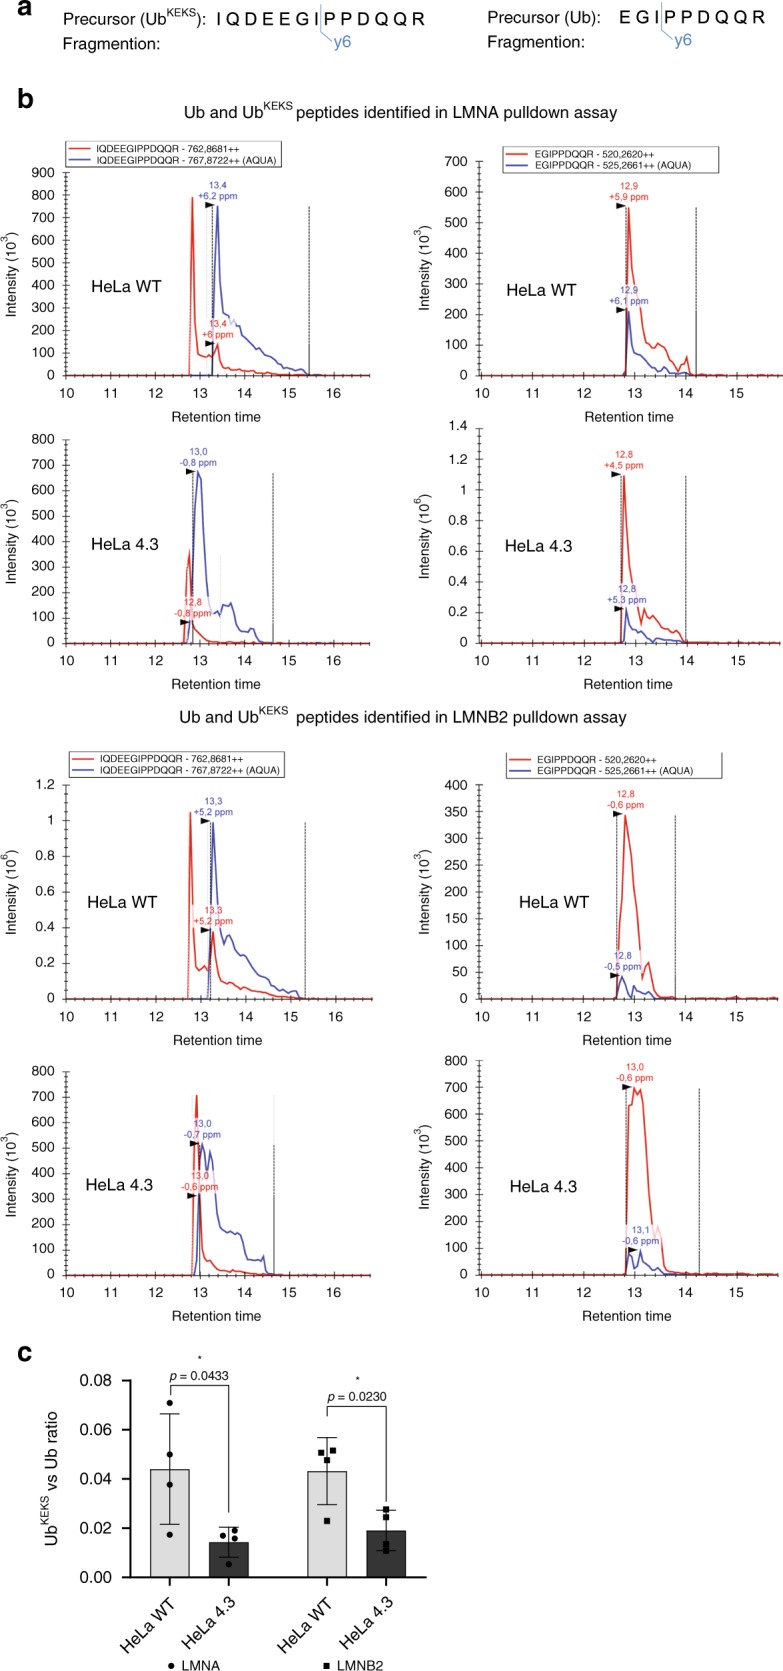
a Precursors and their fragment ions used for quantification of Ub and UbKEKS. b Fragment ion chromatogram of Ub and UbKEKS in WT and UbKEKS KO (clone 4.3) HeLa cells in lamin A (LMNA) and lamin B2 (LMNB2) pulldown assays. Blue line represents heavy (AQUA) peptide, red line represents endogenous peptides with m/z values indicated in the box above chromatograms. Dotted lines indicate peak boundaries with black arrows showing peaks. Peak values with mass error are indicated above each peak. c Ratio of UbKEKS to Ub in WT and UbKEKS KO (clone 4.3) HeLa cells in LMNA and LMNB2 pulldown assays. Data are presented as mean values ± SD; individual data points are superimposed on the bar graph. Statistical analysis was performed using unpaired two-tailed t-test (n = 4 independent experiments). Source data are provided as a Source Data file.