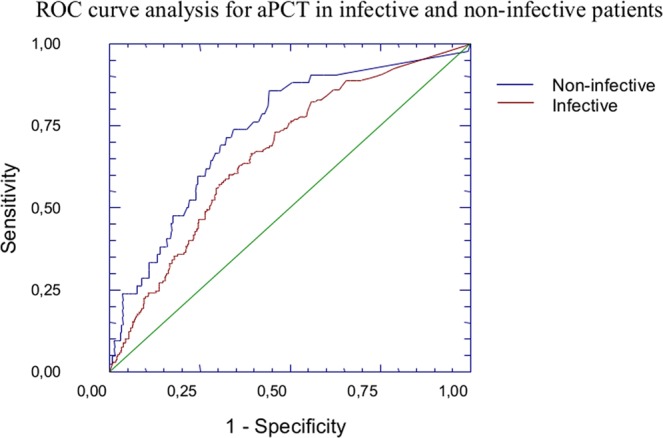
Figure 3.

ROC Curve analysis for aPCT in the subgroups of “infective” and “non-infective” patients. ROC curve analysis showed a good predictive value of aPCT for the composite endpoint (death or transfer in ICU) both in the subpopulation of “infective” (AUC:0.660; 95%CI:0.61–0.70; p < 0.05) and “non-infective” patients (AUC:0.732; 95%CI:0.64–0.80; p < 0.05). When comparing the above-mentioned ROC curves, we observed a significantly better performance of the ROC curve in “non-infective” patients (p < 0.05).
