
Figure 4.
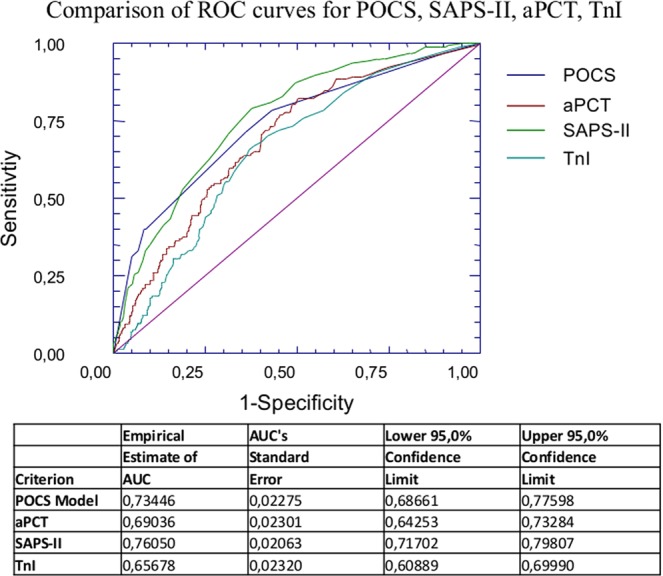
ROC Curve analysis for POCS, SAPS-II, PCT and TnI in the overall sample. In the overall sample, the prognostic performance of aPCT was similar to TnI (AUCaPCT vs AUCTnI p = 0.271) but inferior to SAPS-II (AUCSAPS-II vs AUCaPCT p = 0.0244). We also compared the prognostic performance of POCS model with other indicators as SAPS-II, aPCT or TnI. We did not find any statistically significant difference between AUCPOCS and AUCSAPS-II (p = 0.317), while AUCaPCT and AUCTnI were significantly lower than AUCSAPS-II (AUCaPCT vs AUCSAPS-II p = 0.024; AUCTnI vs AUCSAPS-II p = 0.0009).