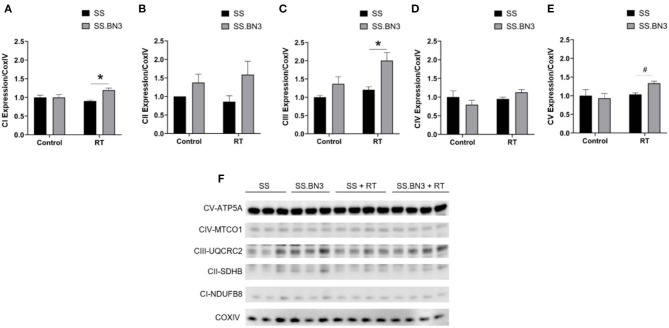
Figure 3.
Oxidative phosphorylation complex expression in rat cardiac mitochondria. Subunits of the mitochondrial complex expression was visualized via Western blotting and quantified. These included (A) Nuclear-coded NDUFB8 Complex I-subunit, (B) Nuclear-coded SDHB Complex II-subunit, (C) Nuclear-coded UQCR2 Complex III-subunit, (D) Mitochondrial-coded MTCO1 Complex IV-subunit, and (E) Nuclear-coded ATP5A Complex V-subunit. All were measured and quantified from a Western blot from mitochondria lysates of rat hearts 12 weeks post-RT or sham treatment (F). Representative blots are originated from different exposure times of the same blot using an antibody cocktail, and technical replicates of the Western blot were run 3 times total, with a representative blot and quantifications from one experiment shown. Values are expressed as means ± SEM normalized to their respective COX IV loading control, and then expressed as fold change relative to the SS sham treated; n = 3–4/ group; *P < 0.05, #P < 0.01. A Student's t-test was used to determine significance in SS vs. SS.BN3 control (lanes 1–3 and 4–6, respectively) and SS vs. SS.BN3 with RT (lanes 7–10 and 11–14, respectively).

