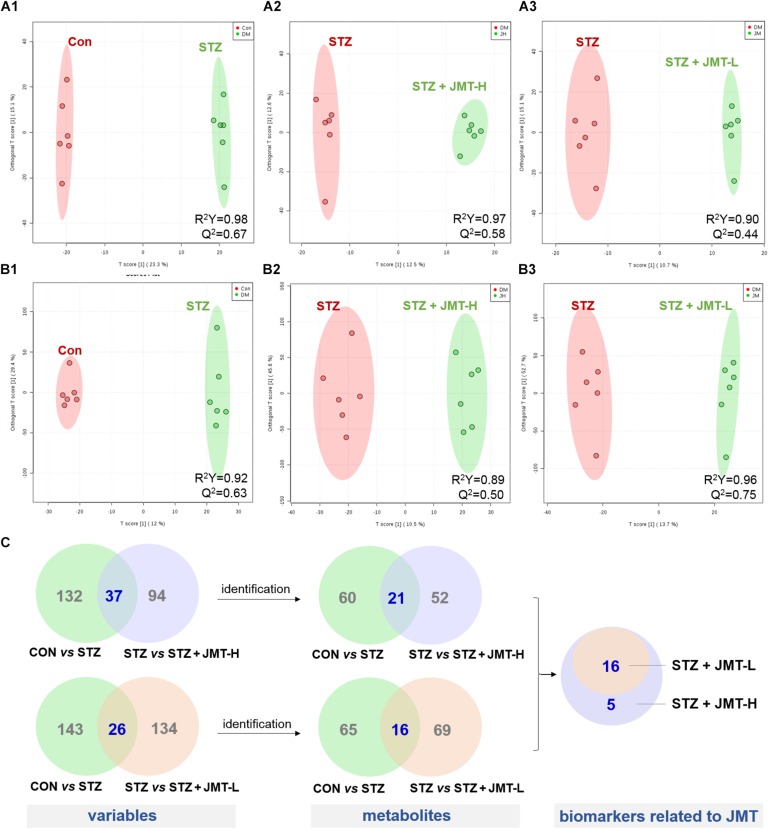
FIGURE 5.
Screening of serum metabolic biomarkers regulated by JMT decoction administration. (A,B) The score plots of OPLS-DA between Control (CON) vs. STZ groups (A1,B1), STZ vs. STZ + JMT-H groups (A2,B2), and STZ vs. STZ + JMT-L groups (A3,B3) in negative and positive ion modes, respectively (n = 6 per group). (C) Venn diagram illustrated the distinct and overlapping metabolites that commonly changed in different groups. The serum levels of 16 metabolites were found to be regulated toward normal by JMT decoction administration at both low and high dosage, while another 5 metabolites were regulated just by JMT decoction at high dosage.

