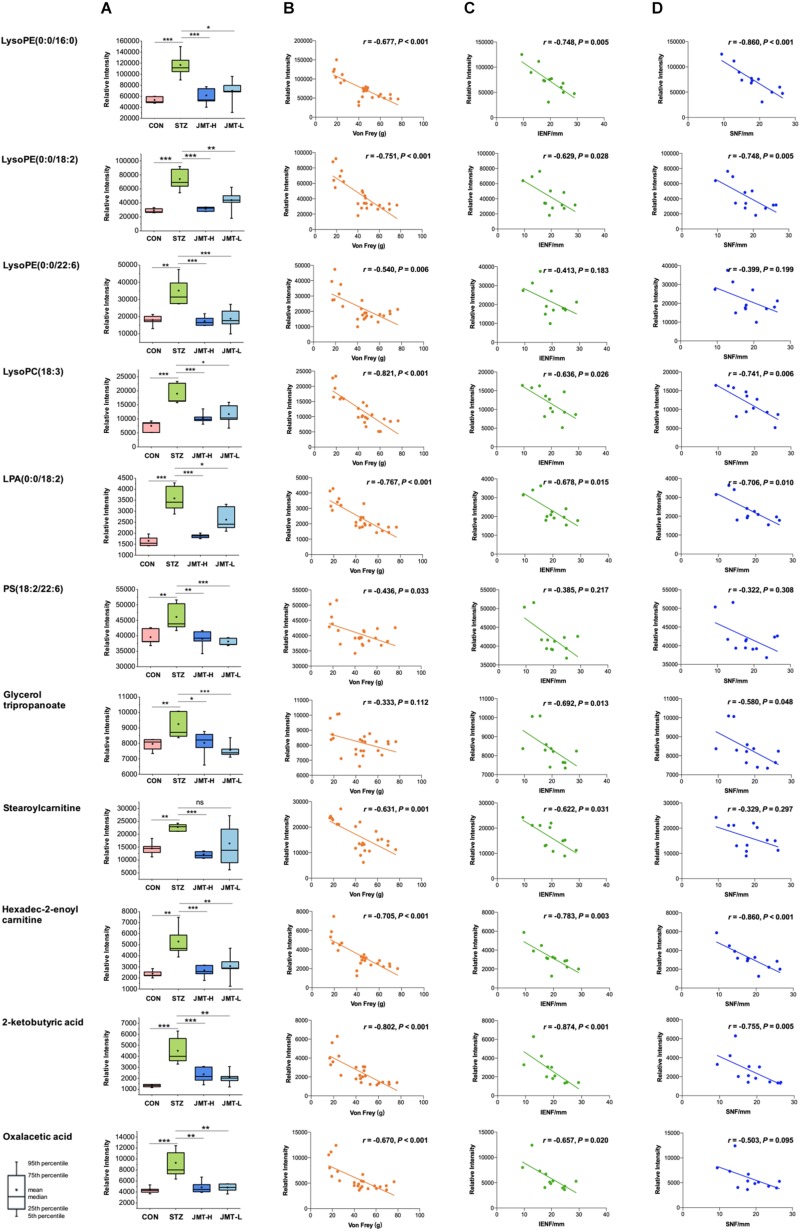
FIGURE 7.
Serum levels of identified biomarkers in different group (A) and their correlations with DPN efficacy indicators (B, Von Frey; C, IENFD; D, SNFD) *P < 0.05, **P < 0.01, and ***P < 0.005. (B) Ten metabolites were significantly negatively correlated with Von Frey (P < 0.05). (C) Nine metabolites were significantly negatively correlated with IENFD (P < 0.05). (D) Seven metabolites were significantly negatively correlated with SNFD (P < 0.05).

