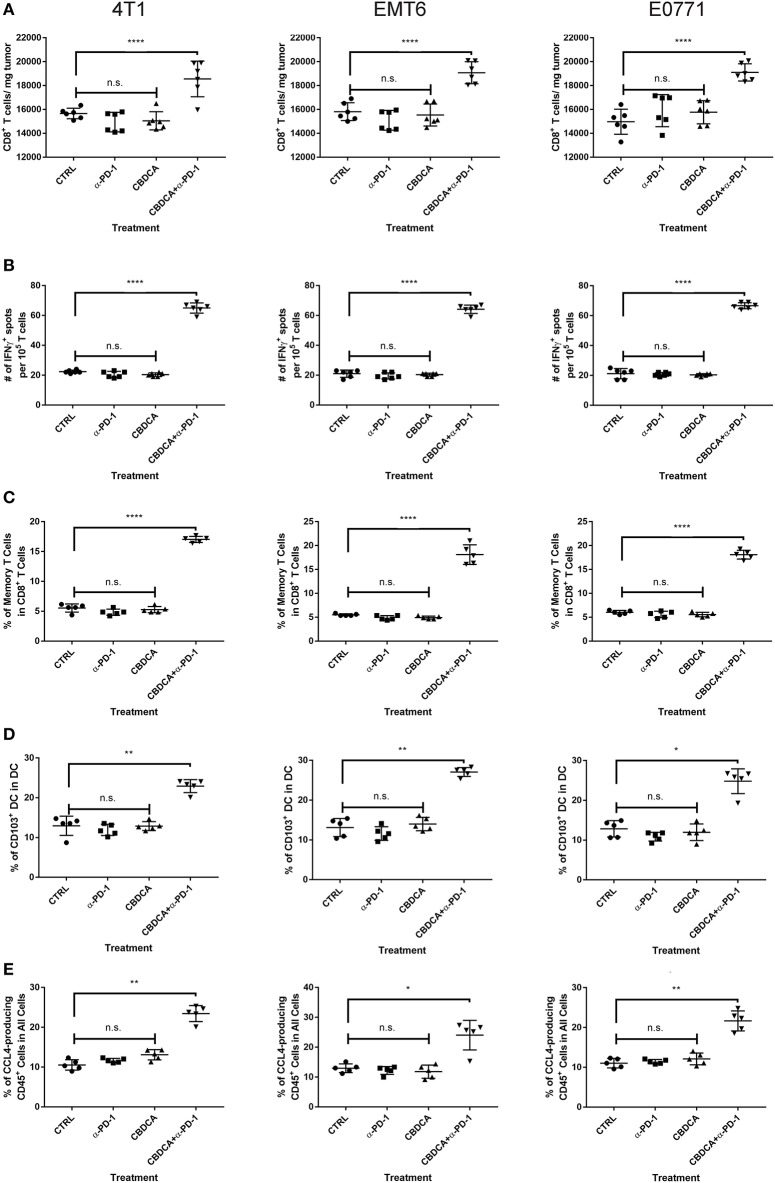
Figure 4.
Major immunological parameters in the tumor microenvironment of the secondary tumor. The primary and secondary tumor implantation, as well as treatment were conducted as the schematic shown in Figure 3. At Day 35 after the primary tumor implantation, tumors were collected for flow cytometry analysis. Left columns: 4T1; middle columns: EMT6; right columns: E0771. (A) The number of CD8+ tumor infiltrating T cells. (B) ELISpot assay. (C) The percentage of memory CD8+ T cells in the tumor. (D) The percentage of CD103+ DC in the tumor. (E) The percentage of CCL4-producing CD45− cells in the tumor. n = 5–6 mice/group from one experiment. *p < 0.05 (CBDCA+α-PD-1 vs. CBDCA, α-PD-1, or CTRL); **p < 0.01 (CBDCA+α-PD-1 vs. CBDCA, α-PD-1, or CTRL); ****p < 0.0001 (CBDCA+α-PD-1 vs. CBDCA, α-PD-1, or CTRL); n.s., no significance (CBDCA vs. α-PD-1 vs. CTRL), by one-way ANOVA with Bonferroni post-hoc tests.

