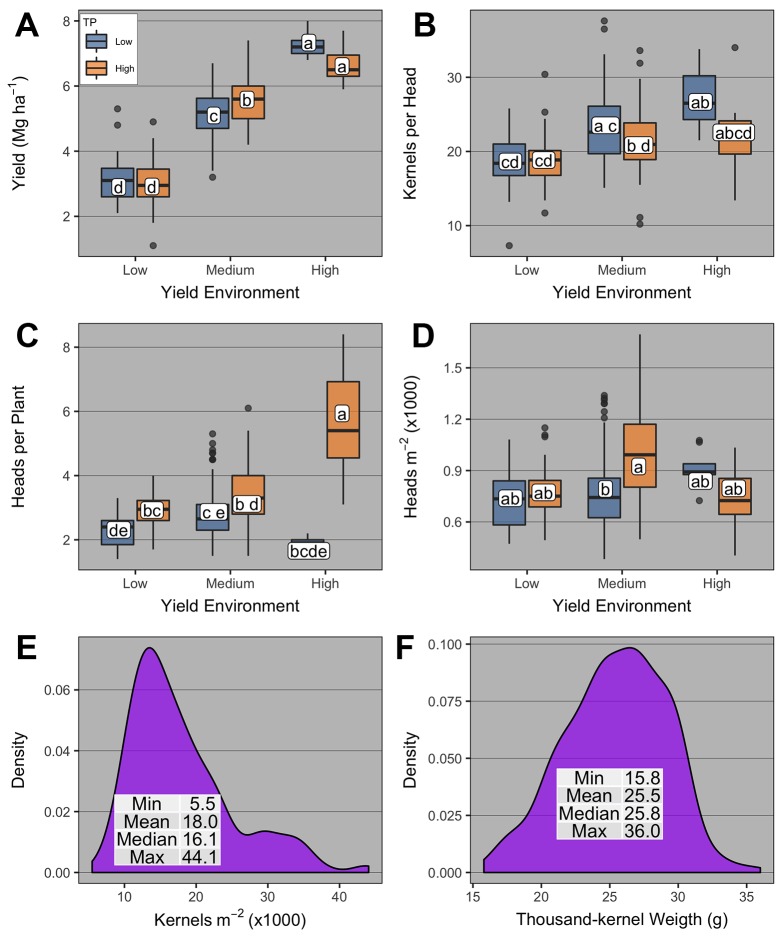
Figure 5.
Boxplots of (A) winter wheat grain yield and yield components [(B) kernels head-1; (C) heads per plant; (D) heads m-2; (E) kernels m-2; and (F) thousand-kernel weight] at the agronomic optimum plant density (AOPD) as affected by yield environment (high, medium, and low), and tillering potential (TP; high and low). Boxplots with the same letter are not statistically different across all levels shown in the panel (α = 0.05). Boxplots portray the 5th (lower whisker), 25th (bottom edge), 50th (solid black line), 75th (top edge), and 95th (upper whisker) quantile.

