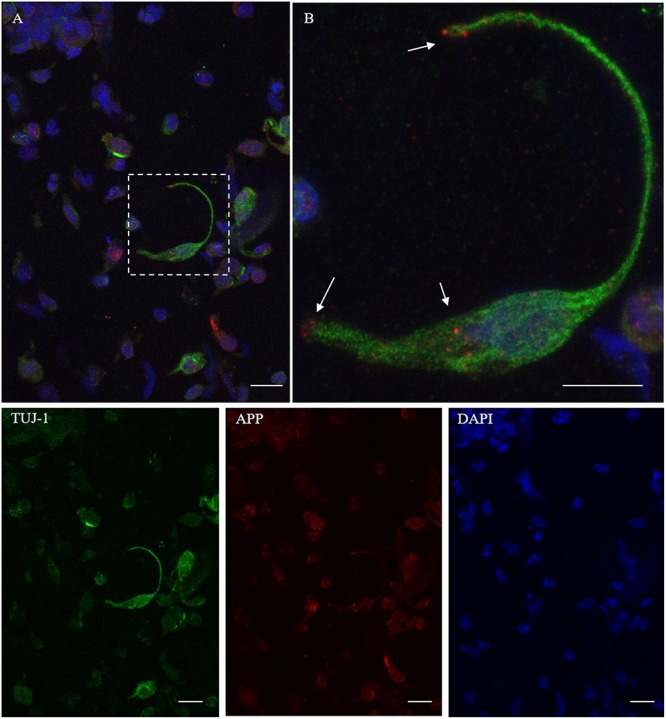
FIGURE 5.

Distribution pattern of β-amyloid. Double immunostaining with TUJ-1 (green) and mAb to β-amyloid (red). Beta-amyloid shows a focal expression (dot-like) in the proximity of the nucleus and at the level of the surface tips of the olfactory neurons [outlined square in (A), details in (B), arrows]. Scale bar (A): 20 μm. Scale bar (B): 10 μm.
