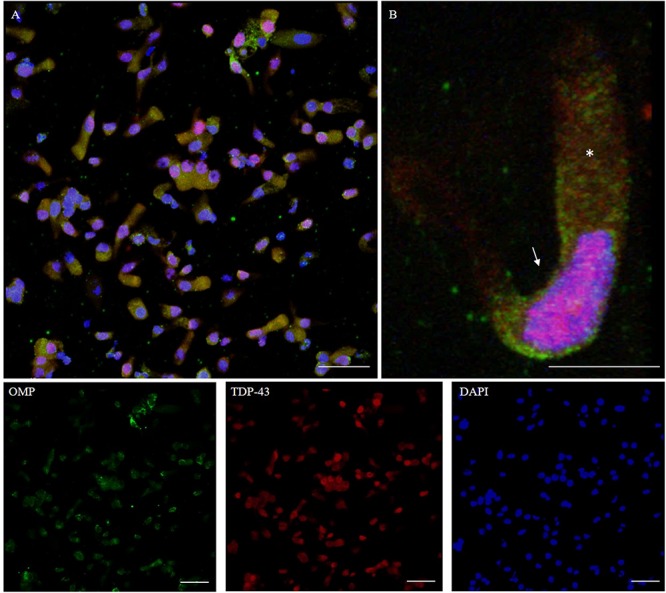
FIGURE 8.

Distribution pattern of TDP-43. Double immunostaining of OM sample with OMP (green) and TDP-43 (red). TDP-43 shows granular staining in the nucleus (arrow) of almost all types of cells, albeit sparing rounded globular cells (A, detail in B). In particular, neuronal-shaped cells, OMP positive, shows an intense TDP-43 positivity in the nucleus and also a weak staining in the cytosol (*). Scale bar (A): 40 μm. Scale bar (B): 10 μm.
