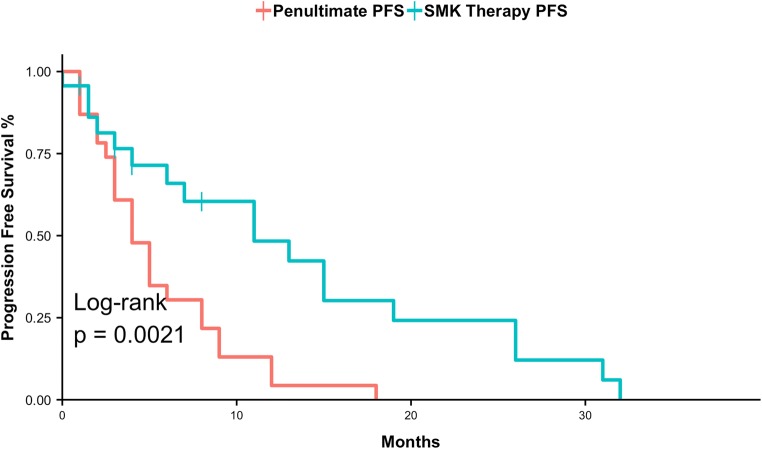
Fig. 3.
PFS following treatment with SMK Therapy compared to penultimate PFS following prior chemotherapy regimens. Kaplan-Meier plot comparing PFS following treatment with SMK Therapy (red) to penultimate PFS (blue). This analysis is based on the 23 subjects for which penultimate PFS data were available

