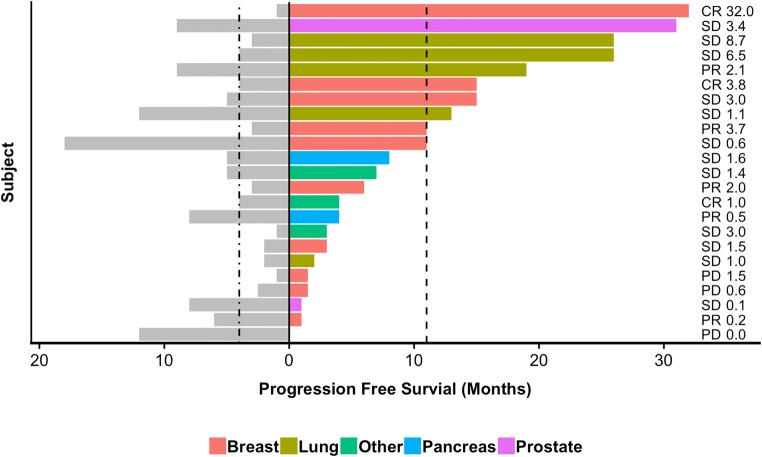
Fig. 4.
PFS following treatment with SMK Therapy and penultimate PFS by subject. For each of the 23 subjects for which penultimate PFS data were available, the duration of penultimate PFS is shown by the gray bars to the left. Colored bars to the right show PFS following treatment with SMK Therapy, with the colors indicating tumor type. Vertical dashed lines indicate the Kaplan-Meier estimated medians. The best response (progressive disease [PD], SD, PR, and CR) following SMK Therapy is indicated for each subject as is the penultimate PFS ratio (SMK Therapy PFS / penultimate PFS)

