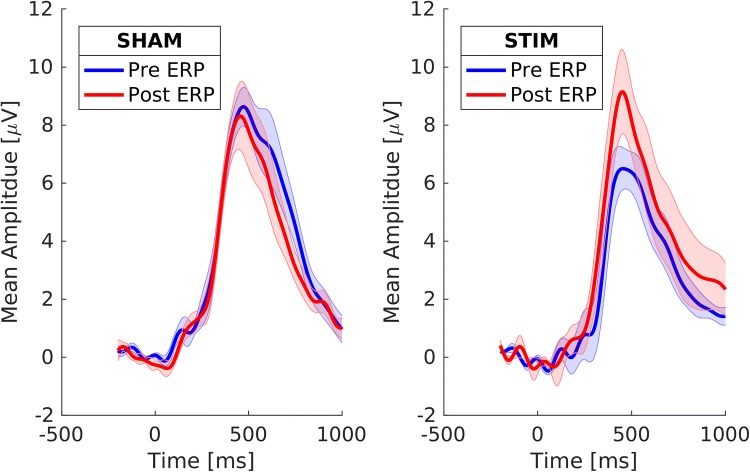
Fig. 5.
P300 modulation. Mean ERPs for all experimental groups and conditions. Shaded intervals display standard error of the mean at all time points. Left: in the sham group, ERPs were not significantly different between pre and post conditions. Right: in the stim group, the P300 amplitude was significantly larger in the post condition as compared to the pre condition. Note that statistics were not computed on absolute values but on relative amplitude change

