Fig. 5.
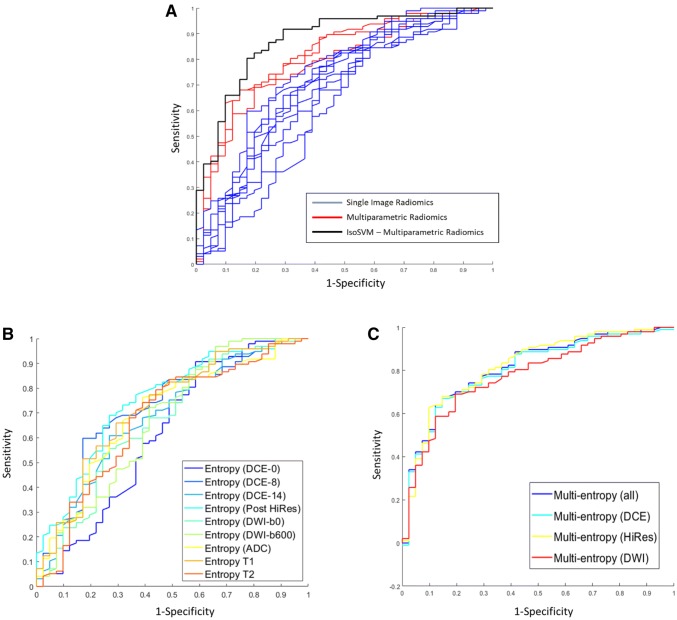
The predictive accuracy between the single parameter based radiomics features and multiparametric radiomics (mpRad) features using receiver operating characteristic (ROC) curve analysis is demonstrated. a The AUC for IsoSVM was 0.87 and shown on the left and displayed in black. The mpRad feature ROC curves (displayed in red) produced area under the ROC curve (AUC) values that were 9–28% greater than the AUCs obtained for single parameter radiomics (ROC curves displayed in blue). b The AUC curves for the each mpRAD feature are shown in the middle. The AUC values for these features ranged from 0.78 to 0.82. c The single radiomic AUC curves for each feature are shown on the right and ranged from 0.62 to 0.75

