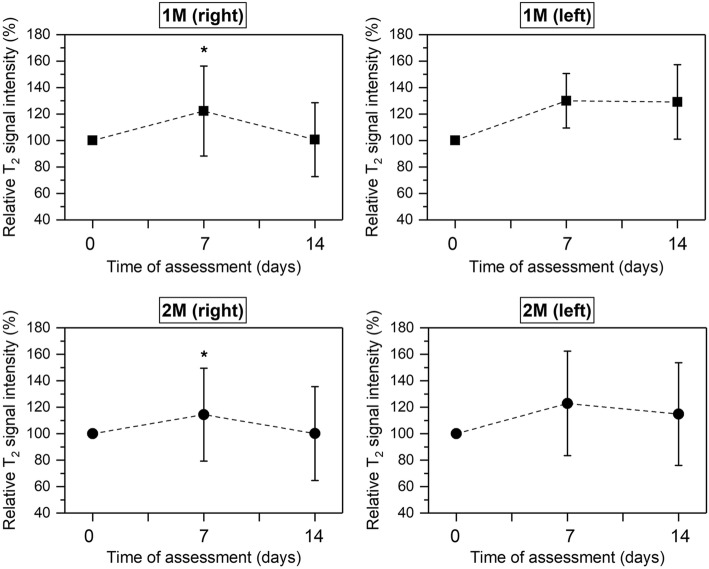
Fig. 3.
Percentage of relative T2-w signal intensity at baseline, 7 and 14 days of experiment measured in first and second upper molars both from the right and left sides. Black dots and squares represent mean values and bars correspond to plus/minus standard deviation. *Significant differences between 7 and 14 days (P < 0.05)

