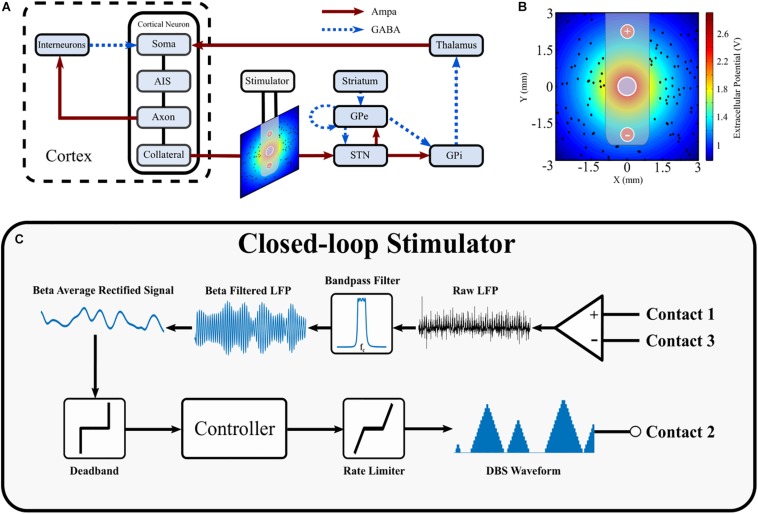
FIGURE 1.
Schematic diagram of cortical basal ganglia network model. (A) Network diagram of cortical basal ganglia neuron populations. Excitatory and inhibitory synaptic connections within the network are represented as solid red arrow and blue dotted arrows, respectively. (B) Electric field distribution due to monopolar stimulation electrode. Cortical collaterals, represented as black dots, are oriented perpendicular to the page. The electrode bipolar recording contacts are represented by + and –, respectively. (C) Schematic diagram of the closed-loop stimulator utilizing an LFP derived measured of network beta-band activity. Contacts 1 and 3 represent the bipolar recording electrode contacts on the DBS electrode. The recorded LFP is bandpass filtered, rectified and averaged to calculate the average rectified value of the LFP beta-band activity. The beta average rectified value is used as input to a controller which determines an updated value for the DBS parameter being modulated. The updated DBS waveform is subsequently simulated at electrode contact 2 and varies the electric field distribution.

