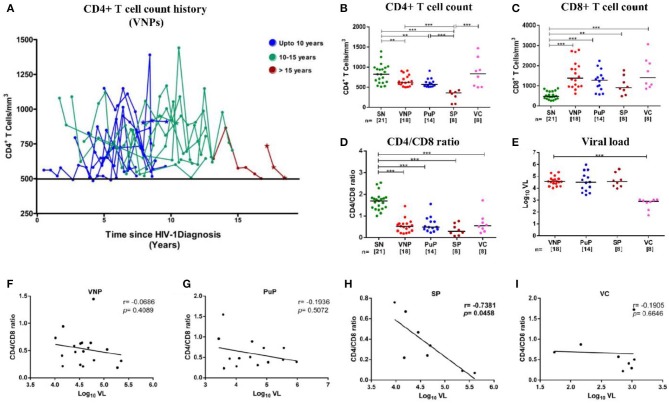
Figure 1.
Distribution of absolute CD4+ T cell count history in viremic non-progressors (VNPs) and clinical, immunological, and virological characteristics of the study groups. (A) 18 VNPs were recruited following stringent criteria. The cutoff absolute count of 500 cells/mm3 is represented by the solid line. The last time point, for each sample, is the time of recruitment of participants for the study. Each line represents one individual. Individuals with <6 data points are represented as a *(n = 3). Color represents years of infection until recruitment for the study: Blue, 7–10 years; Green, 10–15 years; red, >15 years. (B,C) Absolute T cell count in blood as measured by flow cytometry. (B) Absolute CD4+ T cell count. (C) Absolute CD8+ T cell count. (D) CD4/CD8 ratio calculated from absolute CD4+ and CD8+ T cell count. (E) Plasma viral load (Log10 VL). (F–I) Correlation between CD4/CD8 ratio and plasma viral load in (F) VNPs, (G) putative progressors (PuPs), (H) standard progressors (SPs), and (I) viremic controllers (VCs). Comparisons between groups were calculated by Mann–Whitney non-parametric test (*p < 0.05; **p < 0.01; ***p < 0.001). p and r values for associations were determined by Spearman's correlation test, with linear regression shown as a line. Significant (p < 0.05) values are in bold.

