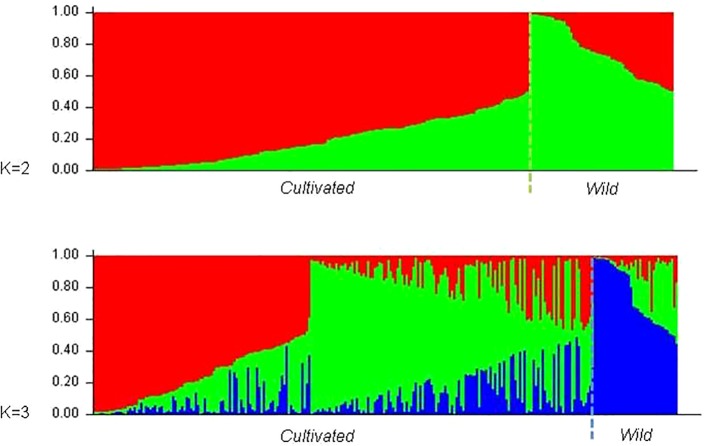
Figure 4.
Barplot of the genetic population admixture in wild vines and cultivated varieties, as inferred by structure at K = 2 and K = 3. Each individual is represented by a single vertical bar broken into K color segments, with lengths proportional to the estimated probability of membership in each inferred cluster.

