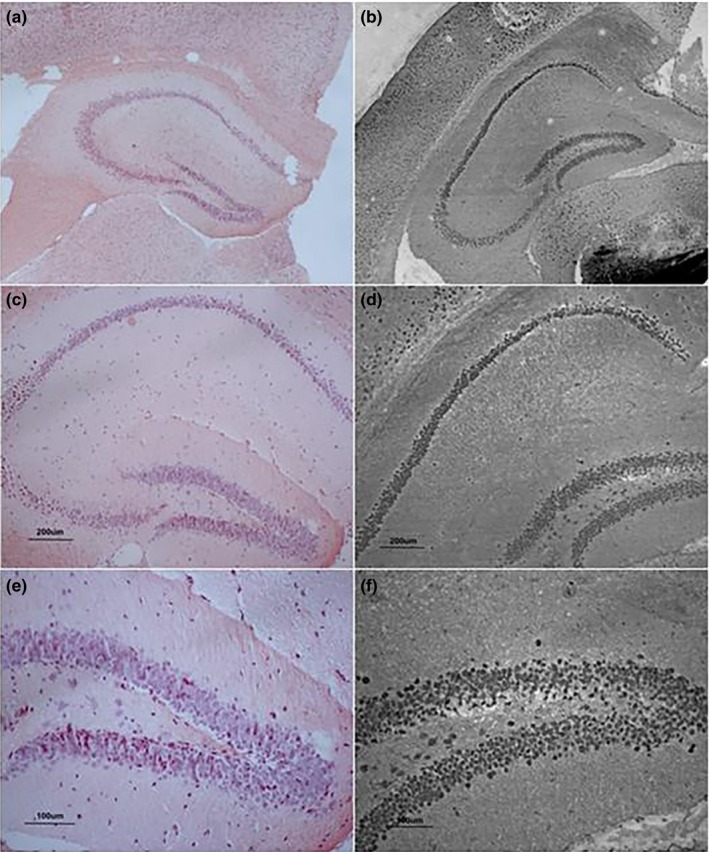
Figure 4.

Congo red and Bielschowsky staining. (a, c, and e) stained by Congo red; and (b, d, and f) stained by Bielschowsky in 22‐month CD‐1 mice; (a and b) represent the higher‐dose lipopolysaccharide (H‐LPS) group, (c and d) represent the lower‐dose lipopolysaccharide (L‐LPS) group, and (e and f) represent the control (CON) group. (a and b) under 40× magnification, (c and d) under 100× magnification, (e and f) under 200× magnification
