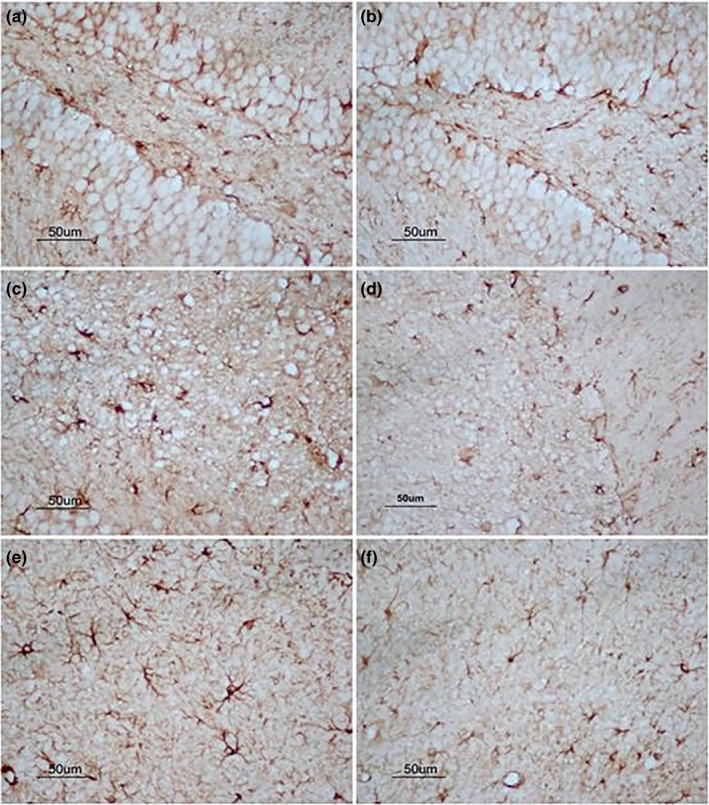
Figure 7.

The expression of GFAP in hippocampus of 22‐month CD‐1 mice. (a, c, and e) represent the expression of GFAP in DG, CA1, and CA3 for the higher‐dose lipopolysaccharide (H‐LPS) group; (b, d, and f) represent the expression of GFAP in DG, CA1, and CA3 for the control (CON) group, respectively; each image under 400× magnification
