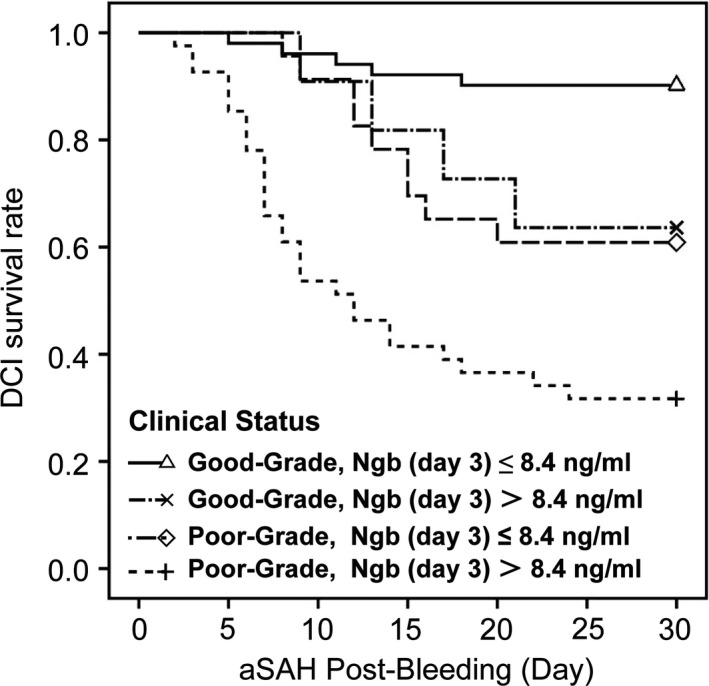
Figure 2.

The Kaplan–Meier curve of the 30‐day DCI survival rate of patients. The Kaplan–Meier curve shows a 30‐day DCI survival rate (i.e., the rate of patients without DCI) of 90.2%(46/51) for good‐grade patients having day 3 Ngb level ≤ 8.4 ng/ml, of 63.6%(7/11) for good‐grade patients having day 3 Ngb level > 8.4 ng/ml, of 60.9%(14/23) for poor‐grade patients having day 3 Ngb level ≤ 8.4 ng/ml, and of 31.7%(13/41) for poor‐grade patients having day 3 Ngb level > 8.4 ng/ml. The log‐rank test showed p < .001. Post hoc log‐rank testing revealed that regardless in good‐grade group or in poor‐grade group, patients having day 3 Ngb level > 8.4 ng/ml has a significantly worse DCI survival rate than those having day 3 Ngb level <=8.4 ng/ml (p = .026 and 0.009, respectively
