
Figure 3.
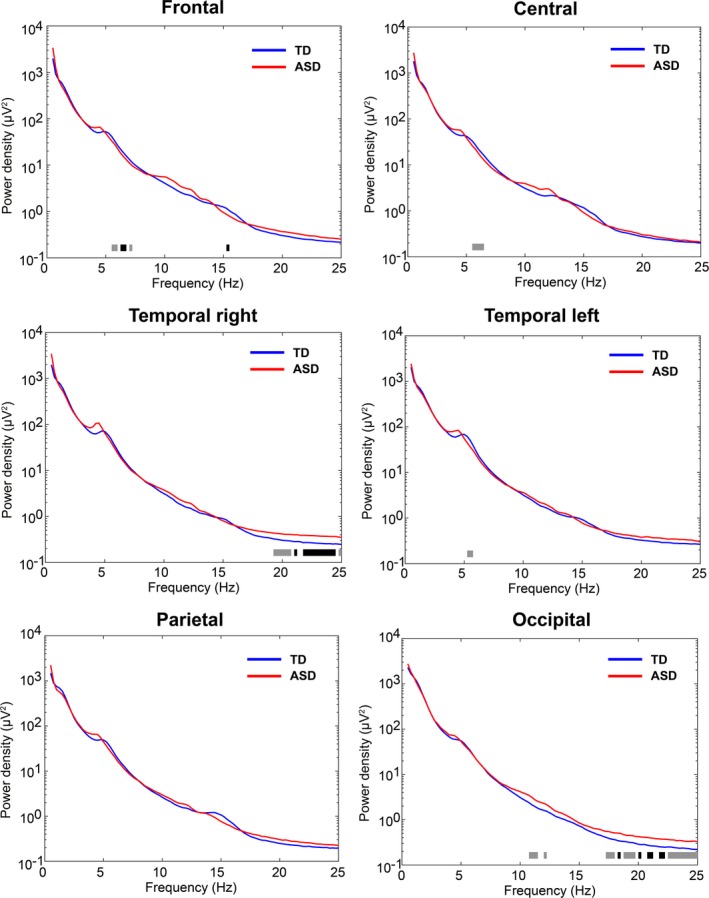
Spectral density for frontal, central, temporal left, temporal right, parietal, and occipital regions across 0.5–25 Hz. Typically developing (TD) and autism spectrum disorder (ASD) are depicted with a blue and red line, respectively. Black bars below the spectral density lines illustrate significant group differences assessed with an ANCOVA (factor group p < .05), and trend‐level differences are illustrated with gray bars (factor group .05 ≤ p < .1)