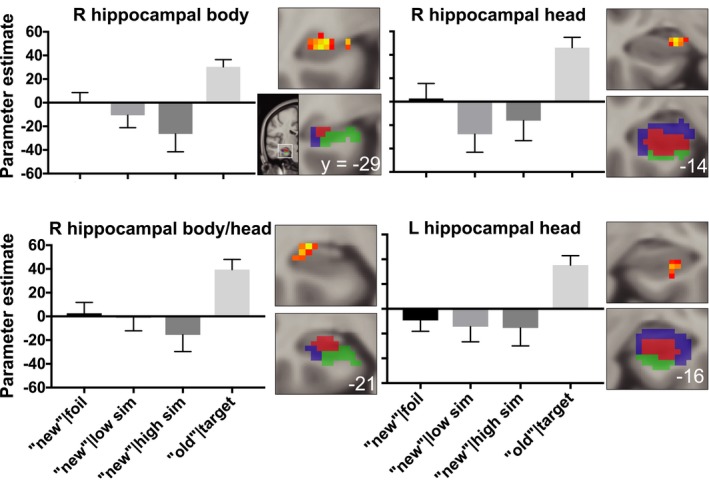
Figure 2.

Four hippocampal clusters identified in the voxel‐wise step function analysis are displayed in red‐yellow on coronal slices (top right of each bar graph). Displayed results were thresholded uncorrected (p < .05, ≥20 contiguous voxels), presented in Montreal Neurological Institute (MNI) 152 space, and in radiological orientation (right = left). For reference, a hippocampal subfield template identified using a multi‐atlas model (see Stark & Stark, 2017 for details) that was aligned to Montreal Neurological Institute (MNI) 152 space displays DG/CA3 (red), CA1 (blue), and subiculum (green) subfields on coronal slices (bottom right of each bar graph). For illustrative purposes, bar graphs display the parameter estimates from each hippocampal cluster identified from the voxel‐wise analysis. Of note, the directionality of the bars in this Figure is inconsequential because the direction of fMRI activity is dependent on multiple elements of the design, including the specific trials being contrasted, the frequency of those conditions, and which conditions are in the model. Thus, we assess step function patterns independent of the direction of the difference. Consistent with mnemonic discrimination, the average activity to correct “new” responses to foils and low‐ and high‐similarity lures differs from activity to correct “old” responses to targets. Error bars display standard error of the mean
