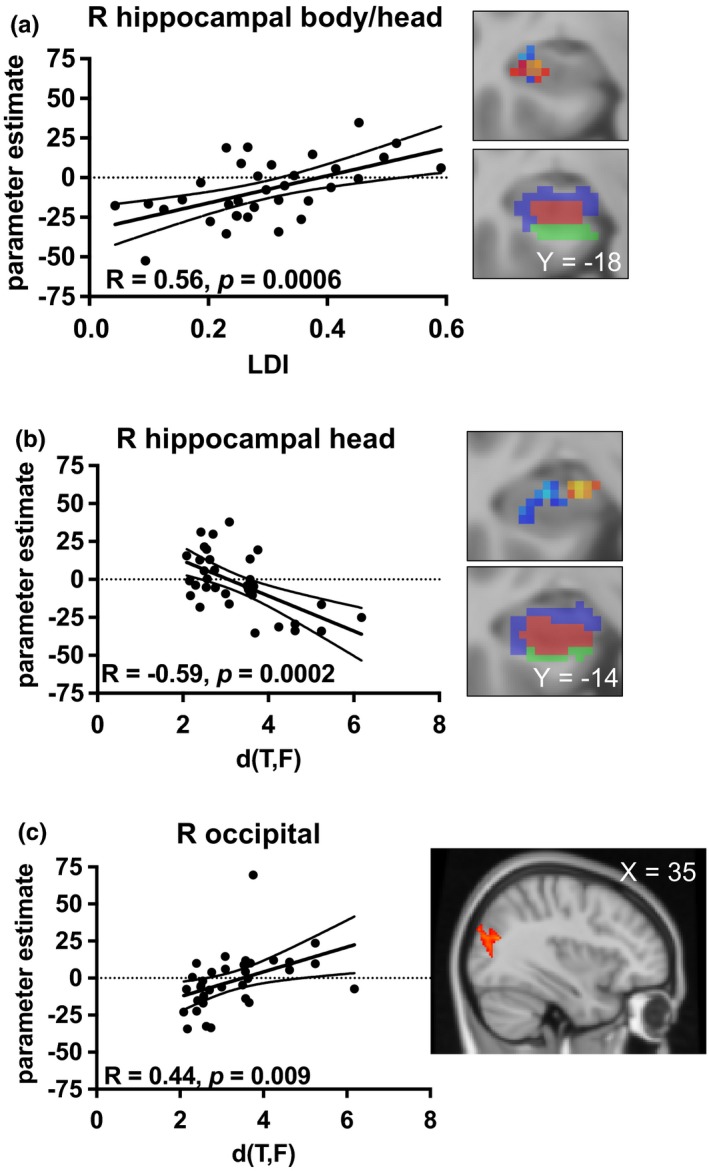
Figure 5.

Scatterplots display relationships between MST performance and parameter estimates from step function activity. For (a) and (b), clusters from the step function analysis and voxel‐wise correlations are shown in red‐yellow and in blue, respectively. Significant relationships were seen between mnemonic discrimination (lure discrimination index, LDI) and activity in right hippocampal body/head (a), and between recognition performance (d′[T,F]) and activity in right hippocampal head (b) and right occipital cortex (c). Dashed lines represent 95% confidence intervals
