

Summary
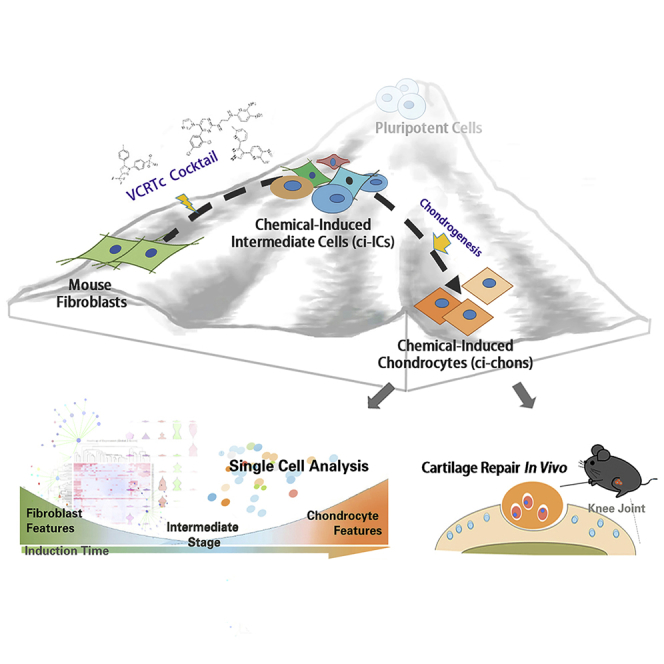
Articular cartilage injury and degeneration causing pain and loss of quality-of-life has become a serious problem for increasingly aged populations. Given the poor self-renewal of adult human chondrocytes, alternative functional cell sources are needed. Direct reprogramming by small molecules potentially offers an oncogene-free and cost-effective approach to generate chondrocytes, but has yet to be investigated. Here, we directly reprogrammed mouse embryonic fibroblasts into PRG4+ chondrocytes using a 3D system with a chemical cocktail, VCRTc (valproic acid, CHIR98014, Repsox, TTNPB, and celecoxib). Using single-cell transcriptomics, we revealed the inhibition of fibroblast features and activation of chondrogenesis pathways in early reprograming, and the intermediate cellular process resembling cartilage development. The in vivo implantation of chemical-induced chondrocytes at defective articular surfaces promoted defect healing and rescued 63.4% of mechanical function loss. Our approach directly converts fibroblasts into functional cartilaginous cells, and also provides insights into potential pharmacological strategies for future cartilage regeneration.
Keywords: chemical reprogramming, single-cell analysis, cartilage regeneration, drug discovery
Graphical Abstract
Highlights
-
•
A chemical method to derive functional murine articular chondrocytes from fibroblasts
-
•
Chemical-induced chondrocytes promote in vivo regeneration of articular defects
-
•
In single-cell analysis, intermediate reprogramming events resemble cartilage development
In this article, Ouyang and colleagues develop a chemical-driven direct reprogramming of mouse embryonic fibroblasts into PRG4+ chondrocytes, with a screen-defined cocktail VCRTc. Their induced chondrocytes promote in vivo cartilage functional regeneration. The dynamical cellular phenotypes were analyzed by single-cell RNA sequencing, illustrating the inhibition of fibroblast features and activation of chondrogenesis pathways in early reprogramming.
Introduction
Articular cartilage is essential for mechanical load-bearing and joint-surface lubrication. Despite its lifelong requirement, human cartilage possesses poor self-renewal capacity against trauma and degeneration (Huey et al., 2012), and its function loss results in joint pain and reduced quality of life. Cartilage defects are really common; a recent study has cited a national knee cartilage surgery incidence of 56 per 100,000 person-years (Engen et al., 2015). If left untreated, cartilage focal defects can lead to osteoarthritis and even permanent damage (Hinckel and Gomoll, 2017). In recent decades, advances in regenerative medicine have brought improvements in the treatment of early cartilage defects, using autologous chondrocyte implantation, a minimally invasive technique showing promising results for cartilage healing (Rakic et al., 2017). This approach has limitations: scar-like tissue (fibrocartilage) rather than intact repair tissue (hyaline cartilage) was produced. Indeed, degeneration and fibrosis at articular cartilage surfaces remains a serious challenge in clinical practice (Craft et al., 2015, Yahara et al., 2016). The lack of functional chondrocytes demands a development of alternative cell sources for articular regeneration.
It has been suggested that specific cell types may be generated by direct conversion of one cell type to another, avoiding passing through a pluripotent stage. This process, termed trans-differentiation or direct reprogramming (Kelaini et al., 2014), was initially achieved by forced expression of defined transcriptional factors (Han et al., 2012, Outani et al., 2013). More recently, small-molecule reprogramming agents have become popular given their non-tumorigenic, cell permeable, and non-immunogenic advantages (Hou et al., 2013). Virus-free chemical conversion of fibroblasts into neural progenitors (Zhang et al., 2016a, Zhang et al., 2016b) and cardiomyocyte lineages (Zhang et al., 2016a, Zhang et al., 2016b) has highlighted its potential applications in regenerative medicine. Yet, despite the successes in cardiomyocytes and neural lineage reprogramming, virus-free induction of fibroblasts into articular chondrocytes has not been reported. Moreover, the induction of chemical reprogramming is a meticulous and complicated process, critical for both the final cell yield and tissue repair. Because of the heterogeneity of cell population being reprogrammed, a sophisticated dissection of dynamical processes at single-cell resolution is necessary, and may provide insights for future applications.
In this study, we have developed a cocktail of five small-molecule compounds, VCRTc (valproic acid, CHIR98014, Repsox, TTNPB, and celecoxib), which converts fibroblasts into articular chondrocytes. We used high-throughput single-cell transcriptomics to systematically analyze the cellular phenotypic changes that occurred in the cell fate transition from fibroblast to the intermediate chondrogenic progenitor state during early reprogramming. We also verified the biological function of the chemical-induced chondrocytes by implanting them into defective articular cartilage to promote its mechanical recovery. Thus, in this proof-of-concept study, we have developed, and characterized, a chemical method to derive functional chondrocytes from fibroblasts, laying the foundation for the application of chemical-induced cell fate reprogramming in cartilage regenerative therapies.
Results
Efficient Fibroblast-to-Chondrocyte Conversion Using a Chemical Cocktail
To develop a chemical cocktail that enables fibroblast-to-chondrocyte conversion, we used a two-stage model for the induction of mouse embryonic fibroblasts (MEFs) based on published results showing that direct reprogramming is a stepwise process (Figure 1A) (Cheng et al., 2014).
Figure 1.

Efficient Fibroblast-to-Chondrocyte Conversion Using a Chemical Cocktail
(A) Schematic diagram of screening strategy for fibroblast-to-chondrocyte reprogramming. MEFs, mouse embryonic fibroblasts.
(B) Representative images of negative and positive controls for Safranin O-fast green staining. Negative/positive controls: MEFs and mouse mesenchymal stem cell line (C3H/10T1/2) cultured in chondrogenic differentiation medium for 14 days. Scare bars, 200 μm.
(C) Representative images of chemical-induced chondrocyte (ci-chon) clusters, stained by Safranin O-fast green, and immunostained by SOX9 and collagen type II (COL2) antibodies. Scale bars, 50 μm.
(D) Col2-pd2EGFP fluorescence observation during chemical reprogramming. Scale bar, 50 μm.
(E) Quantification of cell number in Safranin O+ clusters induced by candidate cocktails in combinatory screening. V, valproic acid (VPA); C, CHIR98014; R, Repsox; T, TTNPB; c, celecoxib; O, olanzapine; D, dopamine HCl. Independent experiments, n = 3.
(F) Percentage of Col2-pd2EGFP+ cells induced by candidate cocktails. Independent experiments, n = 3.
(G) Representative images of Safranin O staining and Col2-pd2EGFP fluorescence in ci-chons derived from VCR- and VCRTc-treated MEFs. Scale bars, 50 μm.
(H) Schematic diagram of the two-step strategy with the optimal combination VCRTc.
Data are means ± SEM, n ≥ 3. ∗p < 0.05, ∗∗p < 0.01, ∗∗∗p < 0.001. See also in Figure S1.
To confirm that the obtained primary MEFs were free of chondrogenic subpopulations, we removed all tissues from head, limbs, visceral tissues, gonads, vertebral column, rib, and sternum during cell isolation. Direct chondrogenesis of MEFs led to fibrous tissues, and no cartilage matrix, which was stained in green by Safranin O-fast green (Figure S1A). Immunostaining demonstrated that the MEFs treated by chondrogenesis medium expressed the fibroblast marker collagen type I (COL1), and not the chondrocyte marker collagen type II (COL2) (Figures S1A and S1C). Using Col2-pd2EGFP reporter mice (Tryfonidou et al., 2011), a strain harboring a Col2-pd2EGFP transgene driven by Col2a1 promotor/enhancer, we also demonstrated the poor chondrogenesis ability of untreated MEFs (Figures S1B and S1C).
During stage 1 of the induction, expanded MEFs were treated with chemical cocktails under 5% O2 for 6 days. Basic chemicals in stage 1 contained valproic acid (V, histone deacetylase inhibitor), CHIR98014 (C, GSK-3 kinases inhibitor), and Repsox (R, transforming growth factor β [TGF-β] inhibitor), as they have been used to facilitate the direct reprogramming of other lineages (Cheng et al., 2014, Han et al., 2017).
Stage 2 involved culturing the cocktail-treated cells in chondrogenic differentiation medium for an additional 14 days (days 6–20). At the end of the induction, we calculated the cell number in Safranin O+ clusters to quantify the fibroblast-to-chondrocyte conversion (Figure 1B), as Safranin O-fast green staining was used for chondrocyte glycosaminoglycan recognition (Oldershaw et al., 2010). Immunostaining for chondrocyte markers SOX9 and COL2 was conducted to characterize their chondrocyte identity (Figure 1C). Using Col2-pd2EGFP reporter mice, we also demonstrated the real-time expression of chondrocyte marker Col2 (Figure 1D). The cellular morphology of MEFs changed into polygonal after chemical reprogramming (Figure S1D).
Elimination of individual components of VCR, and extension of induction time during stage 1 reduced the formation of Safranin O+ cells (Figures S1E and S1F). TGF-β3 was identified as an essential component for chondrogenic medium in stage 2 (Figures S1H and S1I). Thus, these results validated the establishment of the basic model. We used VCR treatment followed by culturing in chondrogenic medium as a basis for further optimizing our induction system.
To identify additional chemical compounds capable of boosting the fibroblast-to-chondrocyte conversion, we screened a library of 48 small molecules known to facilitate reprogramming or regulate chondrogenesis (Table S1). In primary screening, each compound was added either at stage 1 or 2 (Figure 1A). We identified five compounds, treatment with which, together with the VCR cocktail during stage 1, potentially increased the Safranin O+ efficiency (Figure S1J). These were kartogenin (Kgn, K), olanzapine (O), dopamine HCl (D), celecoxib (c), and TTNPB (T) (Table S2). We tested 30 different combinations of these five candidates and found that the combination of TTNPB (a retinoic acid receptor agonist) and celecoxib (a cyclooxygenase [COX] 2 inhibitor) (Figure S1L) together with the VCR (VCRTc) led to one of the best outcomes (Figures 1E and S1K). We further validated the function of the candidate combinations by reprogramming Col2-pd2EGFP MEFs (Figures 1F and 1G). When compared with other groups, cocktail VCRTc resulted in the greatest conversion efficiency, which increased the initial efficiency (VCR group) by ∼4-fold (Figures 1E and 1F). Altogether, we have established a chemical reprogramming system to convert MEFs into chondrocytes using chemical cocktail VCRTc (Figure 1H).
Chemical-Induced Chondrocytes Form Scaffold-free Cartilage Organoids
The micro-mechanical environment provided by 3D cultures has been reported to be essential for chondrogenesis (Benoit et al., 2008). We, therefore, applied bionic 3D culture to the generation of chemical-induced chondrocytes (ci-chons). Although VCRTc produced the most efficient lineage conversion among other groups, the Col2+ efficiency in monolayer culture was still low (∼1%) (Figure 1F). Thus we adopted a high-density micromass culture to promote chondrogenesis during stage 2, using Col2-pd2EGFP MEFs. VCRTc-treated MEFs formed small aggregations spontaneously after micromass attachment (Figures S2A and S2B). These aggregations continued to increase in size and express Col2 (Figure S2A), and the immunostaining images showed they were SOX9+ and COL2+ (Figure S2C).
In the 3D system, we also used suspended pellet culture for better cell collection. VCRTc-treated MEFs self-organized into dense suspended pellets and were cultured for 4 weeks. Mesenchymal condensation marker N-cadherin was expressed in early phase (day 7–10) and SOX9 was continuously expressed during chondrogenic induction, and presented in a higher expression level in late period (days 13–20) (Figure S2C). The pellets grew in size over time (Figure 2C) and expressed Col2 from day 20 (Figure 2A).
Figure 2.

Chemical-Induced Chondrocytes Form Scaffold-free Cartilage Organoids
(A) Representative images of real-time Col2-pd2EGFP observation in 3D ci-chons. Scale bars, 200 μm.
(B) The percentage of viable cells during 3D chondrogenic induction, characterized by trypan blue staining. Independent experiments, n = 3.
(C) The number of large-size pellets (diameter>200 μm) per 5 × 10⁶ cells during 3D chondrogenic induction. Independent experiments, n = 3.
(D) Flow cytometry analysis of Col2-pd2EGFP+ efficiency in MEF and ci-chon pellets.
(E) Immunostaining of chondrocyte markers: aggrecan (ACAN), COL2, proteoglyacan 4 (PRG4), SOX9, and collagen type I (COL1) in MEF and ci-chon pellets. Scale bars, 50 μm.
(F) Efficiency quantification of ACAN, COL2, PRG4, SOX9, and COL1 immunostaining in MEF and ci-chon pellets. Independent experiments, n = 3.
Data are means ± SEM, n ≥ 3. ∗p < 0.05, ∗∗p < 0.01, ∗∗∗p < 0.001. See also in Figure S2.
Flow cytometric analysis showed that ∼20% of the cells in the chemical-induced chondrocyte pellets (ci-chon pellets) expressed Col2 (Figure 2B), much more than those in the monolayer-induced cells (Figure 1F). Immunostaining revealed that 3D-induced ci-chon pellets showed higher expression levels in aggrecan (ACAN), COL2, proteoglyacan 4 (PRG4), and SOX9 relative to MEF pellets (45.33% ± 2.30% vs 3.72% ± 0.19%; 28.41% ± 1.70% vs 2.27% ± 0.96%; 61.15% ± 4.56% vs 8.67% ± 0.66%; 47.24% ± 7.31% vs 8.56% ± 5.17%) (Figures 2E and 2F). The expression of fibroblast/fibrocartilage marker COL1 was lower in ci-chon pellets when compared with MEF pellets (51.01% ± 4.62% vs 76.05% ± 6.69%). The proportion of hypertrophic marker COL10 and RUNX2 was also examined in ci-chon and MEF pellets, being 14.14% ± 1.78% vs 16.57% ± 2.68% and 15.34% ± 2.86% vs 3.53% ± 1.56%, respectively (Figures S2E and S2F).
To characterize ci-chons at mRNA level, we performed single-cell qPCR for 20 osteochondral markers (Table S4). We used MEFs as negative controls, and mouse primary articular chondrocytes (mchons) as positive controls. Subpopulations of ci-chons (subclusters) were identified to express chondrocyte signatures, their proportion of representative chondrocyte markers, Acan, Prg4, Col11a2, and Col2a1, being 14.29%, 26.79%, 12.50%, and 8.03%, respectively (Figures S2G and S2H). Altogether, we have grown ci-chons as scaffold-free cartilage organoids with an order of magnitude increase in induction efficiency compared with monolayer culture.
Single-Cell Transcriptomics of the Fibroblast-to-Chondrocyte Reprogramming
High-throughput single-cell RNA sequencing was used to characterize ∼1,400 cells at different reprogramming stages (Figure S3A): 232 MEFs of day 0; 577 VCRTc-treated MEFs of day 6; 311 3D-induced ci-chons of day 34; and 281 mchons as positive controls. Those mchons were isolated from newborn murine articular cartilages of knee joints based on previously published methods (Salvat et al., 2005) (Figure S3B).
In single-cell RNA sequencing, 6.7 × 10⁵ reads and 3,684 genes were detected on average in each cell. We performed Seurat unbiased clustering and visualized cell expression profiles in two dimensions using principal-component analysis plot. Three clusters were well segregated (Figures 3A and 3B) with a mean of 660 marker genes for each cluster (Figure 3B; Table S3). Among the four cell types, ci-chons were classified into the same cluster (cluster 3) with primary chondrocytes, which was clearly distinct from clusters of MEFs and 6-day fibroblasts (clusters 1 and 2, Figures 3C and S3C), indicating similar transcriptional patterns in ci-chons and mchons (Figure 3B). Nearly 100% of VCRTc-treated fibroblasts of day 6 belonged to cluster 2, which occupied 81.01% of this cluster (Figure S3C). They showed intermediate features between day 0 MEFs and day 34 ci-chons, and thereby were termed chemical-induced intermediate cells (ci-ICs). Gene ontology (GO) analysis (Figure 3D), showed that cluster 3 was dominated by genes regulating cartilage extracellular matrix (ECM) (Figure 3C), while cluster 1 (99.8% MEFs, Figures 3C, 3D, and S3C) was relatively enriched in sterol biosynthesis and lipid metabolic process GO terms. ECM remodeling and metalloendopeptidase activity GO terms were enriched in cluster 2 (Figure 3D).
Figure 3.

Single-Cell Transcriptomics of the Fibroblast-to-Chondrocyte Reprogramming
(A and B) (A) Principal-component analysis (PCA) plot of Seurat unbiased clustering of 232 MEFs, 577 VCRTc-treated MEFs (chemical-induced intermediate cells, ci-ICs); (B) 311 ci-chons, and 281 mouse primary chondrocytes (mchons), marked by cell types and clusters 1, 2, and 3.
(C and D) (C) Heatmap of marker genes and (D) top five enriched gene ontology (GO) terms in clusters 1, 2, and 3, classified by Seurat unbiased clustering.
(E) Heatmap of representative lineage genes in comparison of MEFs, ci-chons, and mchons.
(F) Representative genes identifying phenotype of ci-chons. Data of single-cell RNA sequencing.
Data are means ± SEM, n ≥ 3. ∗p < 0.05, ∗∗p < 0.01, ∗∗∗p < 0.001. See also in Figure S3.
To better delineate the fibroblast-to-chondrocyte reprogramming, we analyzed representative lineage markers in MEFs, ci-chons, and mchons (Figure 3E). Chondrocyte markers (Ucma, Col2a1, Col11a2, and Col9a1) were expressed in 37.6% of the ci-chons and 99.6% of mchons, whereas 96.6% of MEFs showed high expression levels of fibroblast markers, including Postn, Fsp1, and Fbln5 (Figure 3E). To identify the subtype of obtained chondrocytes, we found that Prg4, a biomarker of articular surfaces (Lefebvre and Bhattaram, 2015), was expressed in ∼52% of ci-chons (p < 0.001, Figure 3F), which was also validated by immunostaining (Figures 2E and 2F). Thus, ci-chons shared a similar but not identical gene expression profile to those of mchons. On the other hand, ci-chons expressed moderate levels of the fibroblast marker Col1a1, which was lower than that seen in MEFs, suggesting that fibroblast features had been partially erased during the induction (Figure 3F).
Intermediate Cellular Programs Resemble Cartilage Development
Our screen data suggested that the chemical treatment in stage 1 (day 0–6) was potentially critical for the final chondrocyte yield (Figures 1E, 1F, S1E, and S1K), during which ci-ICs were produced. To understand the chondrogenic features of ci-ICs, we reconstructed the pseudo-temporal trajectory of 577 ci-ICs and 311 ci-chons. By R package Monocle, ci-ICs were classified into two distinct clusters (Figure 4A). The cluster in an earlier pseudo-time order was marked by proliferative genes, such as Mki67 (Figures 4A and 4C). The later ci-IC clusters showed expression of skeletogenesis molecules, including Bmp6, Tgfb2, Wnt4, and Ecm1 (Figure 4C), all involved in cartilage development (Kim and Im, 2009, Kong et al., 2010, Pauk et al., 2015, Später et al., 2006). These ci-ICs with cartilage developmental features, were termed chondrogenic intermediate cells (Chondrogenic ICs). Expression of chondrocyte markers Prg4, Mgp, and Cilp were gradually upregulated during induction and reached maximum expression levels in ci-chons (Figure 4C). Together with our observations on the spontaneous organization of ci-ICs during cartilage organoid induction (Figures S2B and S2C), the cellular programs of the ci-IC subpopulations resembled the process of cartilage formation during embryonic skeletogenesis, which consists of cell condensation, proliferation, and differentiation/ECM production (Jiang and Tuan, 2015). These results were also consistent with our previous clustering analysis (Figure 3D), demonstrating the enrichment of GO terms for ECM organization in ci-ICs.
Figure 4.

Intermediate Cellular Programs Resemble Cartilage Development
(A) Trajectory reconstruction of chondrogenesis induction process reveals subpopulations in ci-ICs: proliferative intermediate cells (Proliferative ICs) and chondrogenic intermediate cells (Chondrogenic ICs).
(B) Gene expression heatmap of top 1,000 differentially expressed genes in a pseudo-temporal order.
(C) Expression dynamics of representative marker genes in proliferative ICs, chondrogenic ICs, and ci-chons.
(D) T-SNE plot visualization of 7 ci-IC clusters.
(E) Heatmap and the corresponding representative genes in 7 ci-IC clusters.
(F) Enriched GO terms in clusters 1, 3, and 7, marked by GO terms of ECM modeling or osteochondrogenesis.
See also in Figure S3.
We further dissected the ci-IC subpopulations using Seurat unbiased clustering, classifying the 577 ci-ICs into 7 clusters, based on a total of 764 differentially expressed markers (Figures 4D–4F, S3D, and S3E). GO terms of ECM region/protein binding were enriched in 3 clusters (Figure 4F). Cluster 3 (16.3% of ci-ICs) was identified to govern osteochondrogenesis regulation/protein complex binding, marked by genes of cartilage/skeletal formation: Col11a1, Ecm1, Spon1, and Mgp (Hafez et al., 2015, Kong et al., 2010, Palmer et al., 2014, Wallin et al., 2000) (Figure 4F). Clusters 1 (22.5% of ci-ICs) and 7 (8.0% of ci-ICs) were enriched for ECM interactions and proteolysis signatures, and showed high expression levels of metalloendopeptidase genes for ECM proteolysis and remodeling (Younis et al., 2006) (Figures 4E and 4F). Collectively, we have uncovered cartilage developmental features in ci-IC subpopulations, where both anabolic and catabolic molecules were stimulated for ECM remodeling, resembling early cartilage development.
Fibroblast Feature Inhibition and Chondrogenesis Activation in Early Reprogramming
Having identified the chondrogenic subpopulations in ci-ICs, we further investigated the major regulatory molecules driving fibroblast-to-chondrocyte reprogramming, especially during the initial stage (stage 1).
Different from MEFs, ci-ICs exhibited a reduced F-actin staining, a distinct shape, and decreased cell size (Figures 5A–5D). We monitored the transcriptome profiles of MEFs and ci-ICs using DESeq2, and identified 2,811 differentially expressed genes (adjusted p <0.01, fold change >2). GO terms relevant to developmental protein, embryonic limb morphology and osteogenesis were enriched in ci-ICs (Figure 5E). Consistently, in a functionally grouped network constructed by CytoScape (Figures S4A and S4B), terms for cartilage development and chondrocyte differentiation were present in upregulated networks (Figure S4A). Volcano plots confirmed that cartilage developmental markers (Tgfb2, Wnt2, and Bmp6) showed enhanced expression in ci-ICs, and that fibroblast markers (Mfap4, S100a4/Fsp1, and Fbln5) were highly expressed in MEFs (Figure S4C).
Figure 5.

Fibroblast Feature Inhibition and Chondrogenesis Activation in Early Reprogramming
(A) Representative images of F-actin (phalloidin) staining in MEFs and ci-ICs. Scale bars, 100 μm.
(B) Relative cell viability of MEFs and ci-ICs. Independent experiments, n = 3.
(C and D) (C) Cell size and (D) nucleus area of MEFs and ci-ICs. Independent experiments, n > 3.
(E) GO analysis of differentially expressed genes in ci-ICs relative to MEFs.
(F and G) (F) Upregulated and (G) downregulated KEGG pathways in ci-ICs, relative to MEFs.
(H) PCA plot displaying bulk RNA profiles of MEFs treated by individual compounds of VCRTc. Untreated MEFs/ci-ICs served as negative/positive controls.
(I and J) Heatmap of representative genes activation/inhibition in involved pathways in MEFs treated by individual compounds.
(K) Characterization of individual compounds' effect on fibroblast-to-chondrocyte conversion, characterized by Col2-pd2EGFP+ efficiency. Independent experiments, n = 3.
Data are means ± SEM, n ≥ 3.∗p < 0.05, ∗∗p < 0.01, ∗∗∗p < 0.001. See also in Figures S4 and S5.
We also performed single-cell qPCR in 112 ci-ICs, detecting 96 genes correlated with osteochondral development, chondrocyte/fibroblast lineage, and stemness/pluripotency (Table S4). Consistently, we found that genes responsible for mesoderm development or chondrogenic progenitor (Wnt9a, Tcf15, and Gli1) (Craft et al., 2013) were expressed in a higher proportion of ci-ICs, whereas fibroblast-associated genes, such as Fsp1, Fbln5, and Mfap4, were expressed in a lower proportion in ci-ICs (Figures S4D and S4E) relative to MEFs. Bulk qPCR demonstrated that ci-ICs obtained increased expression levels of osteochondral developmental markers on day6 (Tcf15, Foxf1a, and Meox1) (Figure S4F). In immunostaining tests, ci-ICs did not exhibit a proliferative activation (marker KI67) or a feature of pluripotency (OCT4) (Figure S4G).
Analysis of KEGG pathways (Figures 5F and 5G) indicated some pathways are upregulated in ci-ICs: protein digestion/absorption, ECM interaction, Wnt, phosphatidylinositol 3-kinase (PI3K)-Akt, and Hippo pathway, all highly correlated with chondrocyte differentiation (Cleary et al., 2015, Goto et al., 2018, Kita et al., 2008, Li et al., 2014) (Figure 5F). Relative to MEFs, cytoskeleton-related pathways were relatively inhibited in ci-ICs (Figure 5G).
To understand the contribution of the individual compounds on early reprogramming, we used bulk RNA sequencing of MEFs treated with VPA, CHIR-98014, Repsox, TTNPB, and celecoxib, respectively. Untreated MEFs and ci-ICs served as negative/positive controls (Figure 5H). According to KEGG pathways involved in early reprogramming (Figures 5F and 5G), we characterized the effect of individual compounds on the representative genes in these pathways (Figures 5I and 5J). TTNPB was responsible for upregulating ∼35% of Wnt pathway genes and ∼52% of TGF-β/Smad pathway genes (adjusted p < 0.01, fold change >2) (Figure 5I). Celecoxib slightly upregulated TGF-β/Smad pathway (29%) (Figure 5I). VPA contributed to 60% of PI3K-Akt pathway activation (Figure 5I). Representative fibroblast-specific genes (Fsp1, Fbln5, and Thy1), Rap1 signaling, and cytoskeleton-associated genes in MEFs were repressed by Repsox (Figure 5J). Celecoxib also inhibited Rap1 signaling genes (30%) and cytoskeleton-associated genes (34%) (Figure 5J).
Consistent with single-cell transcription data (Figure 3D), lipid metabolic genes were significantly suppressed in ci-ICs (adjusted p < 0.01, fold change >2) (Figure S4H). VPA, TTNPB, and celecoxib were responsible for suppressing ∼39%, ∼40%, and ∼37%, respectively, of genes under these GO terms (sterol biosynthetic process and lipid metabolic process). However, CHIR-98014 and Repsox did not contribute to fat metabolism inhibition. We knocked down representative fat metabolic genes (Ptgs1, Ldlr, Pcsk9, and Scd1), as all of these genes were not completely suppressed in samples treated by individual compounds (Figure S4H). We hypothesized that further inhibition of these genes might promote lineage conversion, and found that effective knockdown of Ldlr and Pcsk9 could significantly increase both Saffranin O+ and Col2-pd2EGFP+ efficiency when compared with control group (Figures S4H–S4M, p < 0.001).
The Col2-pd2EGFP reporter system was also used to characterize the requirement of individual compounds' function, revealing that elimination of TTNPB or celecoxib significantly (p < 0.05) reduced reprogramming efficiency (Figure 5K). Thus, the VCRTc cocktail drives fibroblasts into a chondrogenic intermediate state by inhibiting fibroblast features, cytoskeleton, and fat metabolism signaling pathways, and upregulating cartilage developmental genes, through the activation of Wnt and PI3K-Akt pathway.
To exclude the possibility of a minor MEF subpopulation selectively proliferating and differentiating into chondrocytes, we compared cell subpopulations in MEFs and ci-ICs. Based on our Seurat unbiased clustering, ∼59% of MEFs were classified into cluster 2 which also contained ci-ICs (Figures 3C and S3C). We analyzed representative fate markers in the two MEF subpopulations (Figures S5A and S5B). When compared with MEF-1 (MEFs in cluster 1), MEF-2 (MEFs in custer 2) had diminished expression levels of fibroblast markers. However, both MEF subpopulations were clearly distinguished from ci-ICs, showing higher expression levels of fibroblast markers and lower levels of chondrogenesis markers (Figures S5A and S5B), indicating that MEF-2 cells are unlikely to have selectively proliferated to form ci-ICs. To avoid the presence of mesenchymal stem cells or cartilage stem cells in MEFs, we analyzed the expression patterns of stem cell markers in MEF-1, MEF-2, and ci-ICs (Figure S5C). None of MEF subpopulation met the criteria of mesenchymal stem cells (CD73+/CD90+/CD105+/CD166+) (Dominici et al., 2006), nor that of cartilage-derived stem cells (CD73+/CD90+/CD105+/CD146+/CD166+) (Jiang et al., 2016), as stem cell markers were not co-expressed in any single MEF or ci-IC (Figure S6C).
Overall, we demonstrated that (1) ci-ICs obtained chondrogenic progenitor features with higher expression of cartilage developmental genes in early stage; (2) the fibroblast features in ci-ICs were suppressed; and (3) ci-ICs do not exhibit pluripotent/stem cell features.
In Vivo Cartilage Regeneration by Chemical-Induced Chondrocytes
Having demonstrated the similarities between articular chondrocytes and ci-chons, we wished to test the in situ regenerative function of ci-chons. TdTomato-tagged (for in vivo tracing) ci-chon pellets (2 × 10⁵ cells) were implanted into a full-thickness cartilage defect model validated by other groups (Eltawil et al., 2009, Wang et al., 2017). Histological images demonstrated regenerated Safranin O+ cartilage tissues in the ci-chon group (implanted with ci-chons) (Figure 6A), as well as fibrous tissues in the MEF group (implanted with MEF pellets) and the blank group (without cell implantation). Quantitative ICRS-II scoring demonstrated that the implantation of ci-chons led to improved cartilage matrix formation and tissue morphology among the other groups (Figures 6B and S6A). The ci-chon group also exhibited promoted healing with reduced remaining defect area when compared with MEF group (Figure 6F). The expression of COL1 was significantly decreased in the cartilage layer of the ci-chons group, indicating that the implantation of ci-chons reduced the articular surface fibrosis (Figures S6C and S6D).
Figure 6.

In Vivo Cartilage Regeneration by Chemical-Induced Chondrocytes
(A) Representative images of repaired cartilages in full-thickness cartilage defect model, stained by Safranin O-fast green. Blank group: defect without cell transplantation. Scale bars, 100 μm.
(B) Representative ICRS-II parameter quantification of the regenerative cartilages in blank, MEF, and ci-chon group (blinded scores of 4 individuals, n = 5 for each group).
(C) Co-labelling of tdTomato tracing tag and COL2 in injured sites. Scale bars, 50 μm.
(D) General Safranin O-fast green image of the sample in Figure 6C.
(E) Quantification of chondrocytes derived from host cells versus ci-chons in injured sites (n = 5).
(F) The diameter of remaining unfilled defects (n = 5), calculated based on Safranin O-fast green images (Figure S6A).
(G) Effective indentation modulus (Eind), of healthy cartilage (sham group), and repaired cartilages in blank, MEF, and ci-chons groups (n ≥ 3 for each group and 5 measured locations for each sample).
(H) Typical indentation force-versus-depth curves of repaired cartilage defects.
Data are means ± SEM, n ≥ 5. ∗p < 0.05, ∗∗p < 0.01, ∗∗∗p < 0.001. See also in Figure S6.
To eliminate concerns of the spontaneous recovery in the murine model, we also evaluated the contribution of implanted ci-chon pellets to COL2+ cartilage regeneration by tdTomoto tracing. tdTomato was detected in the newly formed tissues by immunofluorescence, with co-localization of COL2 (Figure 6C). More than 60% of the regenerative chondrocytes were identified as tdTomato/COL2 double-positive cells, confirming that ci-chons contributed to most of the newly regenerative cartilage (Figures 6C–6E).
As mechanical properties are important indicators of cartilage function, we used atomic force microscopy (AFM)-based nanoindentation to quantify the effective indentation modulus (Eind), of recovered tissues in the middle of the femoral trochlear groove (Figures 6G and 6H). A stiffness loss was observed in defective cartilages, as reported previously (Franke et al., 2007). The cartilages in the sham group were regarded as healthy positive controls. The Eind of the blank group was reduced to 25% of that in the sham group (34.50 ± 8.38 vs 124.72 ± 13.7 kPa), even given the potential to spontaneously recovery 6 weeks after surgery (Figures 6G and 6H). MEF implantation provided no recovery of mechanical function, the Eind remaining at ∼13% of the level of heathy cartilage (16.76 ± 6.59 kPa). In contrast, 63.4% of the modulus loss was rescued by ci-chon implantation (79.04 ± 14.83 vs 124.72 ± 13.7 kPa in sham group). Thus, we demonstrated that ci-chon implantation contributed substantially to the histological and mechanical recovery of articular cartilage defects, and also reduced fibrosis at articular surfaces.
Discussion
The need for a reliable supply of functional chondrocytes has motivated us to develop a chemical-based approach for the induction of chondrocytes. In this study, we used a 3D induction system and the VCRTc cocktail to directly reprogram mouse fibroblasts into articular chondrocytes, which are capable of enhancing mechanical and histological repair at knee joint surfaces. Our single-cell transcriptome analysis of the fibroblast-to-chondrocyte conversion has also uncovered intermediate cellular states resembling chondrogenic progenitors, primed for a cartilage developmental fate.
Small molecule-based cell reprogramming has significant advantages over gene-induced reprogramming as it has been reported to be non-tumourigenic and non-immunogenic (Zhao et al., 2018). Furthermore, we developed the VCRTc cocktail through the combinatorial screening of a library of Food and Drug Administration-approved drugs and common bioactive inhibitors. The cocktail includes celecoxib and TTNPB, which were potentially essential for our reprogramming (Figure 5K). Regarding the underlying mechanism(s), TTNPB is a retinoic acid receptor (RAR) agonist that has been used for inducing mesoderm from pluripotent cells (Araoka et al., 2014). In other reports, RARβ2 was required for vertebrate somitogenesis (Janesick et al., 2017), which was an early process of skeletogenesis, supporting that TTNPB was helpful to trigger cartilage development. Celecoxib is a COX-2 selective non-steroidal anti-inflammatory drug that has been used in osteoarthritis treatment for decades (Nissen et al., 2016) and also applied as a fibrosis inhibitor (Kamata et al., 2015). In our data, celecoxib significantly inhibited cytoskeleton-associated genes and lipid metabolic genes, consistent with published results that it could modulate actin organization (Behr et al., 2015) and decrease fat deposition (Lu and Archer, 2007). Details of how the two compounds helped drive the fibroblast-to-chondrocyte reprogramming remain to be investigated, but our findings suggest that they have potential in future cartilage regenerative therapy. In addition, we found that effective repression of Ldlr and Pcks9 could increase reprogramming efficiency as both molecules played important roles in lipid metabolism. Low-density lipoprotein receptor (LDLR) is a transport protein that facilitates cholesterol entry into cells (Brown and Goldstein, 1979) and can interact with proprotein convertase subtilisin/kexin 9 (PCSK9) (Tang et al., 2019). LDLR is expressed in vascular smooth muscle cells similarly to osteochondro-progenitors within atherosclerotic plaques (Lin et al., 2016), and may participate in osteogenesis homeostasis (Geng et al., 2011). The underlying mechanisms of LDLR and PCSK9 mediating cartilage formation need further investigation, but our data suggest that lipid metabolism can be a potential target for chemical reprogramming facilitation.
Chemical reprogramming also offers an in vitro model for investigating cell fate decisions. By analyzing the profiles of ∼1,400 single cells at multiple time points, we have uncovered an embryonic skeletogenesis-like fate in cells at an intermediate stage, termed “ci-ICs” (Figure 4). In an effort to identify the cell subpopulation that gives rise to the chondrogenic fate, we characterized a MEF subpopulation (MEF-2, Figure S5A) with specific similarities to ci-ICs when compared with other MEFs. However, all MEF subpopulations were distinguished from ci-ICs in that they showed higher expression of genes associated with fibroblast features and lower expression levels of chondrogenesis markers (Figures S5B and S5C), suggesting that the MEF-2 subpopulation is not likely to selectively form ci-ICs. Neither MEF subpopulations nor ci-ICs possessed the characteristics of mesenchymal stem cells or cartilage stem cells (Figure S5C). Altogether, our findings suggest that the VCRTc chemical cocktail plays a significant role in cell phenotype and plasticity remodeling, which drives MEFs into a chondrogenic fate through the inhibition of fibroblast features and stimulation of chondrogenesis programs. Our chemical-based approach directly reprogramming MEFs into chondrocytes bypassing a stem cell stage (Figures 5 and S5) poses a lower risk for tumor development and shortens induction times.
Cartilage is a load-bearing tissue, thus mechanical properties were regarded as important indicators of cartilage function. Using AFM nanoindentation, we have demonstrated that the implantation of ci-chons rescued 63.4% of the mechanical property loss and contributed over 60% of the newly regenerative cartilage (Figure 6). We suggest that these results are attributed to the 3D self-organized organoids maintaining a more chondrocyte-like phenotype compared with cells derived from 2D dish cultures (Figure 2). Formation of fibrous tissue is the principal cause of joint pain and functional loss (Remst et al., 2013). Indeed, MEF implantation did not improve, and in some cases even worsened the recovery of, joint mechanical properties (Figures 6B, 6G, and 6H). Our insights into the reprogramming pathway illustrate that strategies, such as inhibiting fibroblast features and remodeling ECM, might be used to reprogram fibrous tissues into functional cartilage in situ, thereby rescuing mechanical property loss and promoting chondrocyte redistribution.
In summary, using a cocktail composed of Food and Drug Administration-approved small molecules, we have developed a chemical method to derive functional articular chondrocytes from fibroblasts, which promote regeneration of articular cartilage defects. Through the analysis of single-cell fate dynamics during the chemical reprogramming, we identify the transition of MEFs into an intermediate cell population resembling chondrogenic progenitors. With further optimization, we believe our method will provide a strategy for understanding and manipulating cell fate conversion for cartilage regeneration.
Experimental Procedures
Chemical Induction (Stage 1)
Expanded MEFs that had been cultured in H-DMEM for 48 h (confluency 90%) were then transferred into a chemical conditional medium and maintained for 6 days. The chemical conditional medium was composed of KnockOut Serum Replacer (KSR) medium (Life Technologies), 15% knockout serum replacement, 1% nonessential amino acid (Invitrogen), 1% GlutaMax (Gibico), 1% sodium pyruvate (Gibico), 0.1 mM β-mercaptoethanol (Millipore), and 1,000 U/mL leukemia inhibitory factor (PeproTech). In primary screening, chemical cocktail VCR (valproic acid, 500 μM, Sigma; CHIR-98014, 3 μM Selleck; Repsox (E616542), 1 μM, Selleck) were added in KSR medium. In the optimized induction approach, VCRTc (VCR plus TTNPB, 3 μM, Selleck; celecoxib, 5 μM, Selleck) were added in KSR medium. Cells were cultured at 37°C under 5% O2 (hypoxia) and 5% CO2 in an O2/CO2 incubator (MCO-5M, Sanyo). Medium was changed every 3 days.
Chondrogenic Differentiation (Stage 2)
To start stage 2 for monolayer-induced cells, KSR medium was changed to chondrogenic differentiation medium (H-DMEM supplemented with 10−7 M dexamethasone [Sigma], 50 mg/mL ascorbic acid [Sigma], 1 mM sodium pyruvate [Gibico], 1% ITS + premix [Gibico], and 10 ng/mL TGF-β3 [PeproTech]). For micromass culture, 2 × 10⁵ ci-chons were collected by 0.05% trypsin digestion, suspended in 10 μL medium, and seeded on a Petri dish to form a high-density cell aggregation. After a 3-h-incubation, chondrogenic medium was added. For pellet suspension culture, 2 × 10⁶ cells were collected by 0.05% trypsin digestion, mixed with chondrogenic differentiation medium, and seeded into a Corning Ultra-Low Attachment 6-well plate. After cells formed aggregations spontaneously, medium could be changed every 3 days. The induction duration for monolayer, micromass, and pellet culture were 14, 14, and 28 days, respectively.
Drug Screening for Chondrogenesis-Inducing Cocktails
In brief, in primary screening, we selected 48 small molecules (Table S1) that were known to facilitate reprogramming or regulate chondrogenesis from a chemical library (Selleck). Each compound was applied at either stage 1 or 2, respectively (96 conditions, Figure 1A). We identified 5 compounds (Table S2) as candidates in combinatory screening as they potentially improved reprogramming efficiency. In the combinatory screening, we then tested 30 different combinations of these 5 candidates together with the VCR cocktail. We conducted Safranin O-fast green staining at the end of induction.
Single-Cell RNA Sequencing
Single cells were loaded on a high-throughput Fluidigm C1 IFC. Cell number in each microfluidic chamber was checked under a microscope. Then cell lysis, reverse transcription, and cDNA pre-amplification were performed on the chip according to Fluidigm's standard protocol. Illumina libraries were prepared by Illumina Nextera XT DNA Sample Preparation Kit. Libraries were pooled and sequenced at 150-bp paired-end on one lane of Illumina HiSeq X Ten. After obtaining the digital gene expression data matrix, we used Seurat for dimension reduction, clustering, and differential gene expression analysis, following the publicly available guided tutorials (http://www.satijalab.org/seurat) (Satija et al., 2015). R Bioconductor package Monocle (Trapnell et al., 2014) was used in cell clustering and pseudo-time analysis.
Statistical Analysis
Statistical analysis was performed using GraphPad Prism 5 software. We used unpaired t test for comparisons of the two groups, with Mann-Whitney test (nonparametric) for data not fitting Gaussian distribution. To analyze three or more groups, we used a one-way ANOVA test to identify overall difference, and Tukey test to compare all pairs of groups, or Dunnett’s test to compare all groups versus the control group. For nonparametric tests of three or more groups, Kruskal-Wallis test plus Dunn’s test was applied. Data are shown as mean ± SEM. All data shown were repeated at least three times. No samples were measured repeatedly. ∗p < 0.05, ∗∗p < 0.01, ∗∗∗p < 0.001.
Author Contributions
Conceptualization: H.O. and S.Z.; Software: J.L., B.W., C.A., Q.L., and Y.C.; Investigation: Y.C., B.W., D.Y., X.D., Z.S., and Y.Y.; Resources: H.S., S.Z., and X.Z.; Writing – Original Draft: Y.C. and H.O.; Writing – Review & Editing: J.J., V.B., A.H., X.D., Y.Y., and H.O.; Visualization: Y.C.; Project Administration: H.O., S.Z., and J.Z.
Acknowledgments
This work was supported by the National Key R&D Program of China (2017YFA0104900), the Natural Sciences Foundation of China (31830029, 81630065, and 81672162), and Zhejiang Province Grant (2011ZDA006). The authors thank Weiwei Yi from Hangzhou Normal University for assistance in flow cytometry sorting. The authors acknowledge William A. Hortonfrom Oregon Health and Science University for generously providing Col2-pd2EGFP transgenic mice.
Published: February 20, 2020
Footnotes
Supplemental Information can be found online at https://doi.org/10.1016/j.stemcr.2020.01.013.
Accession Numbers
The accession number for the RNA sequencing raw data was reported in this paper is GEO: GSE118236.
Supplemental Information
References
- Araoka T., Mae S., Kurose Y., Uesugi M., Ohta A., Yamanaka S., Osafune K. Efficient and rapid induction of human iPSCs/ESCs into nephrogenic intermediate mesoderm using small molecule-based differentiation methods. PLoS One. 2014;9:e84881. doi: 10.1371/journal.pone.0084881. [DOI] [PMC free article] [PubMed] [Google Scholar]
- Behr C.A., Hesketh A.J., Barlow M., Glick R.D., Symons M., Steinberg B.M., Soffer S.Z. Celecoxib inhibits Ewing sarcoma cell migration via actin modulation. J. Surg. Res. 2015;198:424–433. doi: 10.1016/j.jss.2015.03.085. [DOI] [PubMed] [Google Scholar]
- Benoit D.S., Schwartz M.P., Durney A.R., Anseth K.S. Small functional groups for controlled differentiation of hydrogel-encapsulated human mesenchymal stem cells. Nat. Mater. 2008;7:816–823. doi: 10.1038/nmat2269. [DOI] [PMC free article] [PubMed] [Google Scholar]
- Brown M.S., Goldstein J.L. Receptor-mediated endocytosis: insights from the lipoprotein receptor system. Proc. Natl. Acad. Sci. U S A. 1979;76:3330–3337. doi: 10.1073/pnas.76.7.3330. [DOI] [PMC free article] [PubMed] [Google Scholar]
- Cheng L., Hu W., Qiu B., Zhao J., Yu Y., Guan W., Wang M., Yang W., Pei G. Generation of neural progenitor cells by chemical cocktails and hypoxia. Cell Res. 2014;24:665–679. doi: 10.1038/cr.2014.32. [DOI] [PMC free article] [PubMed] [Google Scholar]
- Cleary M.A., van Osch G.J., Brama P.A., Hellingman C.A., Narcisi R. FGF, TGFβ and Wnt crosstalk: embryonic to in vitro cartilage development from mesenchymal stem cells. J. Tissue Eng. Regen. Med. 2015;9:332–342. doi: 10.1002/term.1744. [DOI] [PubMed] [Google Scholar]
- Craft A.M., Ahmed N., Rockel J.S., Baht G.S., Alman B.A., Kandel R.A., Grigoriadis A.E., Keller G.M. Specification of chondrocytes and cartilage tissues from embryonic stem cells. Development. 2013;140:2597–2610. doi: 10.1242/dev.087890. [DOI] [PubMed] [Google Scholar]
- Craft A.M., Rockel J.S., Nartiss Y., Kandel R.A., Alman B.A., Keller G.M. Generation of articular chondrocytes from human pluripotent stem cells. Nat. Biotechnol. 2015;33:638–645. doi: 10.1038/nbt.3210. [DOI] [PubMed] [Google Scholar]
- Dominici M., Le B.K., Mueller I., Slaper-Cortenbach I., Marini F., Krause D., Deans R., Keating A., Dj P., Horwitz E. Minimal criteria for defining multipotent mesenchymal stromal cells. The International Society for Cellular Therapy position statement. Cytotherapy. 2006;8:315–317. doi: 10.1080/14653240600855905. [DOI] [PubMed] [Google Scholar]
- Eltawil N.M., De Bari C., Achan P., Pitzalis C., Dell'accio F. A novel in vivo murine model of cartilage regeneration. Age and strain-dependent outcome after joint surface injury. Osteoarthritis Cartilage. 2009;17:695–704. doi: 10.1016/j.joca.2008.11.003. [DOI] [PMC free article] [PubMed] [Google Scholar]
- Engen C.N., Årøen A., Engebretsen L. Incidence of knee cartilage surgery in Norway, 2008-2011. BMJ Open. 2015;5:e008423. doi: 10.1136/bmjopen-2015-008423. [DOI] [PMC free article] [PubMed] [Google Scholar]
- Franke O., Durst K., Maier V., Göken M., Birkholz T., Schneider H., Hennig F., Gelse K. Mechanical properties of hyaline and repair cartilage studied by nanoindentation. Acta Biomater. 2007;3:873–881. doi: 10.1016/j.actbio.2007.04.005. [DOI] [PubMed] [Google Scholar]
- Geng Y., Hsu J.J., Lu J., Ting T.C., Miyazaki M., Demer L.L., Tintut Y. Role of cellular cholesterol metabolism in vascular cell calcification. J. Biol. Chem. 2011;286:33701–33706. doi: 10.1074/jbc.M111.269639. [DOI] [PMC free article] [PubMed] [Google Scholar]
- Goto H., Nishio M., To Y., Oishi T., Miyachi Y., Maehama T., Nishina H., Akiyama H., Mak T.W., Makii Y. Loss of Mob1a/b in mice results in chondrodysplasia due to YAP1/TAZ-TEAD-dependent repression of SOX9. Development. 2018;145 doi: 10.1242/dev.159244. [DOI] [PubMed] [Google Scholar]
- Hafez A., Squires R., Pedracini A., Joshi A., Seegmiller R.E., Oxford J.T. Col11a1 regulates bone microarchitecture during embryonic development. J. Dev. Biol. 2015;3:158–176. doi: 10.3390/jdb3040158. [DOI] [PMC free article] [PubMed] [Google Scholar]
- Han D.W., Tapia N., Hermann A., Hemmer K., Höing S., Araúzo-Bravo M.J., Zaehres H., Wu G., Frank S., Moritz S. Direct reprogramming of fibroblasts into neural stem cells by defined factors. Cell Stem Cell. 2012;10:465–472. doi: 10.1016/j.stem.2012.02.021. [DOI] [PubMed] [Google Scholar]
- Han X., Yu H., Huang D., Xu Y., Saadatpour A., Li X., Wang L., Yu J., Pinello L., Lai S. A molecular roadmap for induced multi-lineage trans-differentiation of fibroblasts by chemical combinations. Cell Res. 2017;27:386–401. doi: 10.1038/cr.2017.17. [DOI] [PMC free article] [PubMed] [Google Scholar]
- Hinckel B.B., Gomoll A.H. Autologous chondrocytes and next-generation matrix-based autologous chondrocyte implantation. Clin. Sports Med. 2017;36:525–548. doi: 10.1016/j.csm.2017.02.008. [DOI] [PubMed] [Google Scholar]
- Hou P., Li Y., Zhang X., Liu C., Guan J., Li H., Zhao T., Ye J., Yang W., Liu K. Pluripotent stem cells induced from mouse somatic cells by small-molecule compounds. Science. 2013;341:651–654. doi: 10.1126/science.1239278. [DOI] [PubMed] [Google Scholar]
- Huey D.J., Hu J.C., Athanasiou K.A. Unlike bone, cartilage regeneration remains elusive. Science. 2012;338:917–921. doi: 10.1126/science.1222454. [DOI] [PMC free article] [PubMed] [Google Scholar]
- Janesick A., Tang W., Nguyen T.T.L., Blumberg B. RARβ2 is required for vertebrate somitogenesis. Development. 2017;144:1997–2008. doi: 10.1242/dev.144345. [DOI] [PubMed] [Google Scholar]
- Jiang Y., Cai Y., Zhang W., Yin Z., Hu C., Tong T., Lu P., Zhang S., Neculai D., Tuan R.S. Human cartilage-derived progenitor cells from committed chondrocytes for efficient cartilage repair and regeneration. Stem Cells Transl. Med. 2016;5:733–744. doi: 10.5966/sctm.2015-0192. [DOI] [PMC free article] [PubMed] [Google Scholar]
- Jiang Y., Tuan R.S. Origin and function of cartilage stem/progenitor cells in osteoarthritis. Nat. Rev. Rheumatol. 2015;11:206–212. doi: 10.1038/nrrheum.2014.200. [DOI] [PMC free article] [PubMed] [Google Scholar]
- Kamata M., Hosono K., Fujita T., Kamata K., Majima M. Role of cyclooxygenase-2 in the development of interstitial fibrosis in kidneys following unilateral ureteral obstruction in mice. Biomed. Pharmacother. 2015;70:174–180. doi: 10.1016/j.biopha.2015.01.010. [DOI] [PubMed] [Google Scholar]
- Kelaini S., Cochrane A., Margariti A. Direct reprogramming of adult cells: avoiding the pluripotent state. Stem Cells Cloning. 2014;7:19–29. doi: 10.2147/SCCAA.S38006. [DOI] [PMC free article] [PubMed] [Google Scholar]
- Kim H.J., Im G.I. Combination of transforming growth factor-beta2 and bone morphogenetic protein 7 enhances chondrogenesis from adipose tissue-derived mesenchymal stem cells. Tissue Eng. A. 2009;15:1543–1551. doi: 10.1089/ten.tea.2008.0368. [DOI] [PubMed] [Google Scholar]
- Kita K., Kimura T., Nakamura N., Yoshikawa H., Nakano T. PI3K/Akt signaling as a key regulatory pathway for chondrocyte terminal differentiation. Genes Cells. 2008;13:839–850. doi: 10.1111/j.1365-2443.2008.01209.x. [DOI] [PubMed] [Google Scholar]
- Kong L., Tian Q., Guo F., Mucignat M.T., Perris R., Sercu S., Merregaert J., Di C.P.E., Liu C.J. Interaction between cartilage oligomeric matrix protein and extracellular matrix protein 1 mediates endochondral bone growth. Matrix Biol. 2010;29:276–286. doi: 10.1016/j.matbio.2010.01.007. [DOI] [PMC free article] [PubMed] [Google Scholar]
- Lefebvre V., Bhattaram P. Prg4-expressing cells: articular stem cells or differentiated progeny in the articular chondrocyte lineage. Arthritis Rheumatol. 2015;67:1151–1154. doi: 10.1002/art.39045. [DOI] [PMC free article] [PubMed] [Google Scholar]
- Li Z., Lu H., Li Z.B. The PI3K/Akt signalling pathway may play an internal role related to abnormal condylar growth: a preliminary study. Int. J. Oral Maxillofac. Surg. 2014;43:1477–1483. doi: 10.1016/j.ijom.2014.05.015. [DOI] [PubMed] [Google Scholar]
- Lin M.E., Chen T.M., Wallingford M.C., Nguyen N.B., Yamada S., Sawangmake C., Zhang J., Speer M.Y., Giachelli C.M. Runx2 deletion in smooth muscle cells inhibits vascular osteochondrogenesis and calcification but not atherosclerotic lesion formation. Cardiovasc. Res. 2016;112:606–616. doi: 10.1093/cvr/cvw205. [DOI] [PMC free article] [PubMed] [Google Scholar]
- Lu S., Archer M.C. Celecoxib decreases fatty acid synthase expression via down-regulation of c-Jun N-terminal kinase-1. Exp. Biol. Med. (Maywood) 2007;232:643–653. [PubMed] [Google Scholar]
- Nissen S.E., Yeomans N.D., Solomon D.H., Lüscher T.F., Libby P., Husni M.E., Graham D.Y., Borer J.S., Wisniewski L.M., Wolski K.E. Cardiovascular safety of celecoxib, naproxen, or ibuprofen for arthritis. N. Engl. J. Med. 2016;375:2519–2529. doi: 10.1056/NEJMoa1611593. [DOI] [PubMed] [Google Scholar]
- Oldershaw R.A., Baxter M.A., Lowe E.T., Bates N., Grady L.M., Soncin F., Brison D.R., Hardingham T.E., Kimber S.J. Directed differentiation of human embryonic stem cells toward chondrocytes. Nat. Biotechnol. 2010;28:1187–1194. doi: 10.1038/nbt.1683. [DOI] [PubMed] [Google Scholar]
- Outani H., Okada M., Yamashita A., Nakagawa K., Yoshikawa H., Tsumaki N. Direct induction of chondrogenic cells from human dermal fibroblast culture by defined factors. PLoS One. 2013;8:e77365. doi: 10.1371/journal.pone.0077365. [DOI] [PMC free article] [PubMed] [Google Scholar]
- Palmer G.D., Attur M.G., Yang Q., Liu J., Moon P., Beier F., Abramson S.B. F-spondin deficient mice have a high bone mass phenotype. PLoS One. 2014;9:e98388. doi: 10.1371/journal.pone.0098388. [DOI] [PMC free article] [PubMed] [Google Scholar]
- Pauk M., Grgurevic L., Brkljacic J., Kufner V., Bordukalo-Niksic T., Grabusic K., Razdorov G., Rogic D., Zuvic M., Oppermann H. Exogenous BMP7 corrects plasma iron overload and bone loss in Bmp6–/– mice. Int. Orthop. 2015;39:161–172. doi: 10.1007/s00264-014-2550-4. [DOI] [PubMed] [Google Scholar]
- Rakic R., Bourdon B., Hervieu M., Branly T., Legendre F., Saulnier N., Audigié F., Maddens S., Demoor M., Galera P. RNA interference and BMP-2 stimulation allows equine chondrocytes redifferentiation in 3D-hypoxia cell culture model: application for matrix-induced autologous chondrocyte implantation. Int. J. Mol. Sci. 2017;18 doi: 10.3390/ijms18091842. [DOI] [PMC free article] [PubMed] [Google Scholar]
- Remst D.F., Blaney D.E.N., Vitters E.L., Blom A.B., Stoop R., Snabel J.M., Bank R.A., van den Berg W.B., van der Kraan P.M. Osteoarthritis-related fibrosis is associated with both elevated pyridinoline cross-link formation and lysyl hydroxylase 2b expression. Osteoarthritis Cartilage. 2013;21:157–164. doi: 10.1016/j.joca.2012.10.002. [DOI] [PubMed] [Google Scholar]
- Salvat C., Pigenet A., Humbert L., Berenbaum F., Thirion S. Immature murine articular chondrocytes in primary culture: a new tool for investigating cartilage. Osteoarthritis Cartilage. 2005;13:243–249. doi: 10.1016/j.joca.2004.11.008. [DOI] [PubMed] [Google Scholar]
- Satija R., Farrell J.A., Gennert D., Schier A.F., Regev A. Spatial reconstruction of single-cell gene expression data. Nat. Biotechnol. 2015;33:495–502. doi: 10.1038/nbt.3192. [DOI] [PMC free article] [PubMed] [Google Scholar]
- Später D., Hill T.P., Gruber M., Hartmann C. Role of canonical Wnt-signalling in joint formation. Eur. Cell Mater. 2006;12:71–80. doi: 10.22203/ecm.v012a09. [DOI] [PubMed] [Google Scholar]
- Tang Z.H., Li T.H., Peng J., Zheng J., Li T.T., Liu L.S., Jiang Z.S., Zheng X.L. PCSK9: a novel inflammation modulator in atherosclerosis. J. Cell Physiol. 2019;234:2345–2355. doi: 10.1002/jcp.27254. [DOI] [PubMed] [Google Scholar]
- Trapnell C., Cacchiarelli D., Grimsby J., Pokharel P., Li S., Morse M., Lennon N.J., Livak K.J., Mikkelsen T.S., Rinn J.L. The dynamics and regulators of cell fate decisions are revealed by pseudotemporal ordering of single cells. Nat. Biotechnol. 2014;32:381–386. doi: 10.1038/nbt.2859. [DOI] [PMC free article] [PubMed] [Google Scholar]
- Tryfonidou M.A., Lunstrum G.P., Hendriks K., Riemers F.M., Wubbolts R., Hazewinkel H.A., Degnin C.R., Horton W.A. Novel type II collagen reporter mice: new tool for assessing collagen 2α1 expression in vivo and in vitro. Dev. Dyn. 2011;240:663–673. doi: 10.1002/dvdy.22569. [DOI] [PubMed] [Google Scholar]
- Wallin R., Cain D., Hutson S.M., Sane D.C., Loeser R. Modulation of the binding of matrix Gla protein (MGP) to bone morphogenetic protein-2 (BMP-2) Thromb. Haemost. 2000;84:1039–1044. [PubMed] [Google Scholar]
- Wang J., Zhang F., Tsang W.P., Wan C., Wu C. Fabrication of injectable high strength hydrogel based on 4-arm star PEG for cartilage tissue engineering. Biomaterials. 2017;120:11–21. doi: 10.1016/j.biomaterials.2016.12.015. [DOI] [PubMed] [Google Scholar]
- Yahara Y., Takemori H., Okada M., Kosai A., Yamashita A., Kobayashi T., Fujita K., Itoh Y., Nakamura M., Fuchino H. Pterosin B prevents chondrocyte hypertrophy and osteoarthritis in mice by inhibiting Sik3. Nat. Commun. 2016;7:10959. doi: 10.1038/ncomms10959. [DOI] [PMC free article] [PubMed] [Google Scholar]
- Younis H.S., Jessen B.A., Wu E.Y., Stevens G.J. Inhibiting matrix metalloproteinases with prinomastat produces abnormalities in fetal growth and development in rats. Birth Defects Res. B Dev. Reprod. Toxicol. 2006;77:95–103. doi: 10.1002/bdrb.20073. [DOI] [PubMed] [Google Scholar]
- Zhang M., Lin Y.H., Sun Y.J., Zhu S., Zheng J., Liu K., Cao N., Li K., Huang Y., Ding S. Pharmacological reprogramming of fibroblasts into neural stem cells by signaling-directed transcriptional activation. Cell Stem Cell. 2016;18:653–667. doi: 10.1016/j.stem.2016.03.020. [DOI] [PMC free article] [PubMed] [Google Scholar]
- Zhang Y., Cao N., Huang Y., Spencer C.I., Fu J.D., Yu C., Liu K., Nie B., Xu T., Li K. Expandable cardiovascular progenitor cells reprogrammed from fibroblasts. Cell Stem Cell. 2016;18:368–381. doi: 10.1016/j.stem.2016.02.001. [DOI] [PMC free article] [PubMed] [Google Scholar]
- Zhao T., Fu Y., Zhu J., Liu Y., Zhang Q., Yi Z., Chen S., Jiao Z., Xu X., Xu J. Single-cell RNA-seq reveals dynamic early embryonic-like programs during chemical reprogramming. Cell Stem Cell. 2018;23:31–45.e7. doi: 10.1016/j.stem.2018.05.025. [DOI] [PubMed] [Google Scholar]
Associated Data
This section collects any data citations, data availability statements, or supplementary materials included in this article.