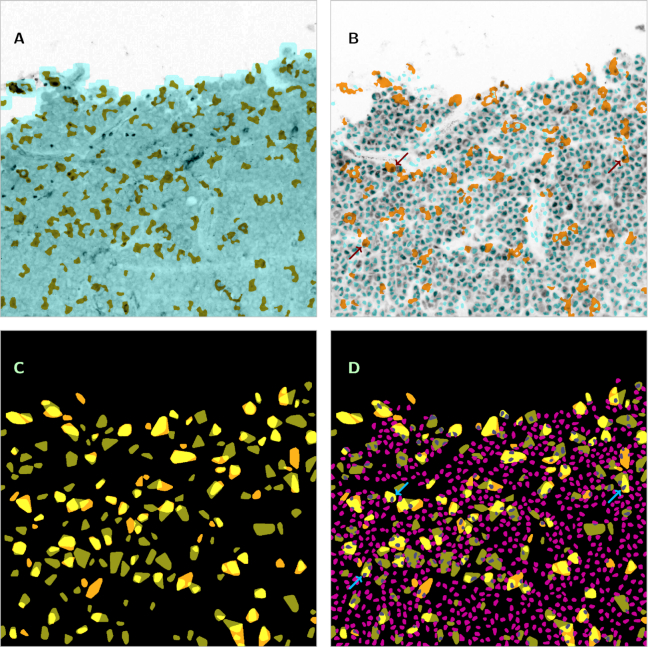
Figure 2.
Examples of combined information from several images, based on specimen_02_tile_01_06_... Image size is 1,000 × 1,000 pixels (450 × 450 μm2). A: Original image at CD14 channel (greyscale, contrast enhanced by a factor of 3.5, inverted) (channel_CD14_type_original_mode_gs.png) with superimposition of the mask of the evaluation subregion, as obtained from the DAPI channel (light blue) (channel_DAPI_type_evalmask_mode_bw.png) and the segmentation of the CD14-stained macrophages (olive green) (channel_CD14_type_segment_mode_bw.png). B: The same tile as imaged at the Pax5 channel (greyscale, inverted) (channel_Pax5_type_original_mode_gs.png) with superimposition of the cell nuclei segmentation from the DAPI channel (light blue, convex hulls) (channel_DAPI_type_convhull_mode_bw.png) and the segmentation of the CD163-stained macrophages (dark yellow) (channel_CD163_type_segment_mode_bw.png). Examples of B-cells positioned inside macrophages indicated by arrows. C: Combination of both macrophage segmentations (olive green or dark yellow, convex hulls) for the same tile in order to reveal double-stained parts (light yellow) ( channel_CD14_type_convhull_mode_bw.png / channel_CD163_type_convhull_mode_bw.png). D: Segmentation of B-cells from the Pax5 channel (magenta and grey, convex hulls) (channel_Pax5_type_convhull_mode_bw.png) superimposed to Fig. 2C. Examples of B-cells positioned inside macrophages indicated by arrows (the same cells as in Fig. 2B).

