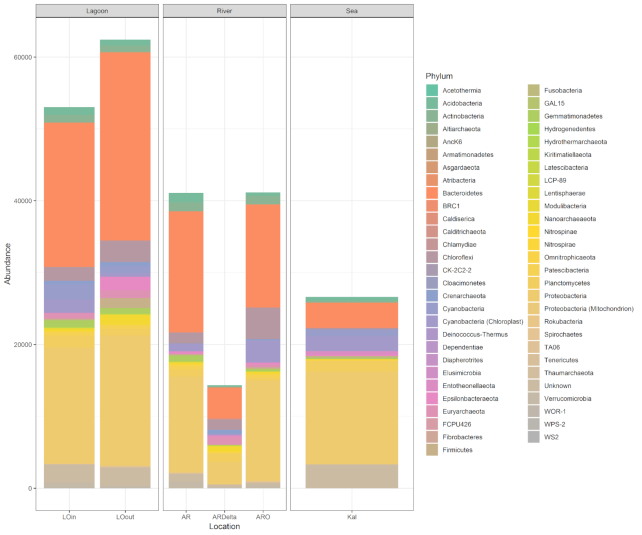
Figure 3:
OTU bar plot at the phylum level. Bar plot depicting the taxonomy of the retrieved OTUs from PEMA for the dataset of Pavloudi et al. [49], at the phylum level for the case of the 16S marker gene. AR: Arachthos; ARO: Arachthos Neochori; ARDelta: Arachthos Delta; LOin: Logarou station inside the lagoon; LOout: Logarou station in the channel connecting the lagoon to the gulf; Kal: Kalamitsi.

