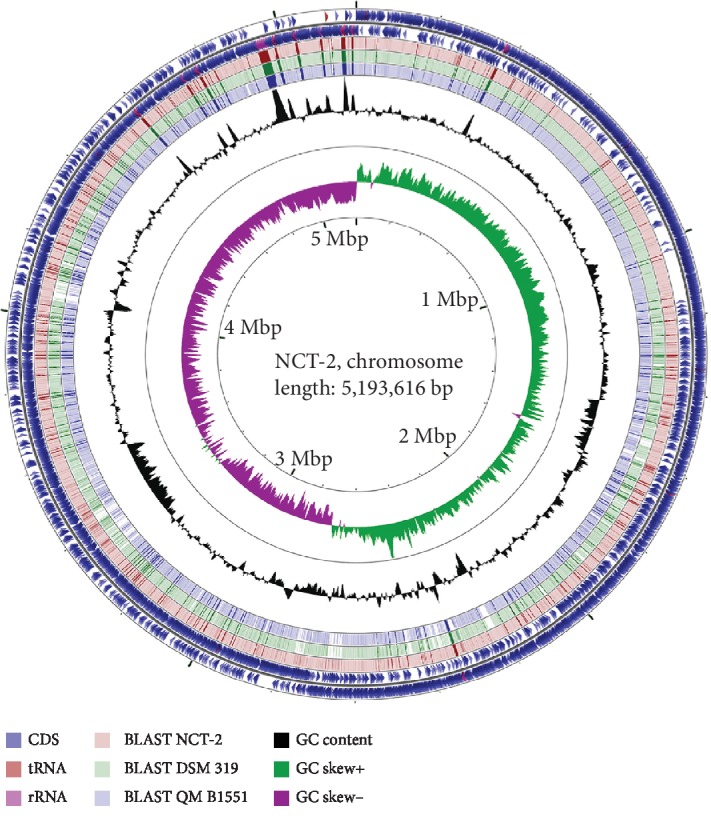
Figure 1.

Genetic and physical map of the genome of B. megaterium NCT-2 prepared using CGView. Circles from the outside to the inside show the position of protein-coding sequences (blue), tRNA gene (red), and rRNA genes (pink) on the positive (circle 1) and negative (circle 2) strands. Circles 3-5 show the positions of BLAST hits detected through BLASTx comparisons of B. megaterium NCT-2 against itself (circle 3), B. megaterium DSM 319 (circle 4), and B. megaterium QM B1551 (circle 5). Circles 6 and 7 show plots of GC content and GC skew plotted as the deviation from the average for the entire sequence.
