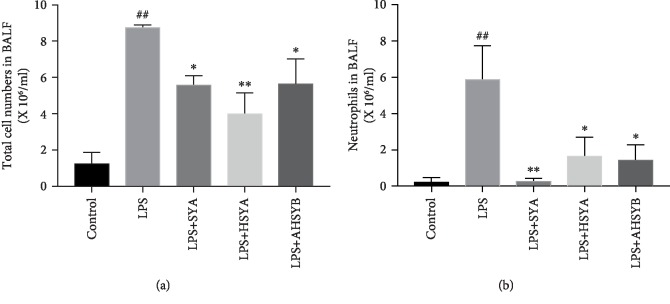
Figure 4.
Effects of SYA, HSYA, and AHSYB on inflammatory cells induced by LPS. (a) The total cells detected by flow cytometry in BALF. (b) The neutrophils detected by flow cytometry in BALF. The values presented are mean ± SEM, ##P < 0.01 vs the control group; #P < 0.05 vs the control group; ∗P < 0.05 vs the LPS group; ∗∗P < 0.01 vs the LPS group.

