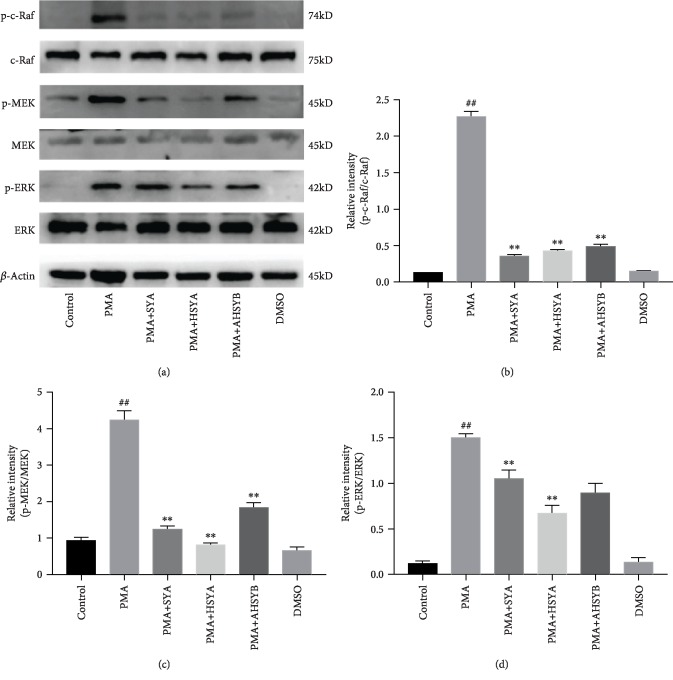
Figure 8.
Effects of SYA, HSYA, and AHSYB on Raf/MEK/ERK signaling pathway expression in cells. (a) Protein levels of p-c-Raf, c-Raf, p-MEK, MEK, p-ERK, and ERK in cell homogenates were assessed by western blot analysis 3 h after PMA stimulation. (b–d) Densitometric analysis of the relevant bands was performed. The values presented are mean ± SEM. ##P < 0.01 vs the control group; #P < 0.05 vs the control group; ∗P < 0.05 vs the LPS group; ∗∗P < 0.01 vs the LPS group.

