Figure 6.

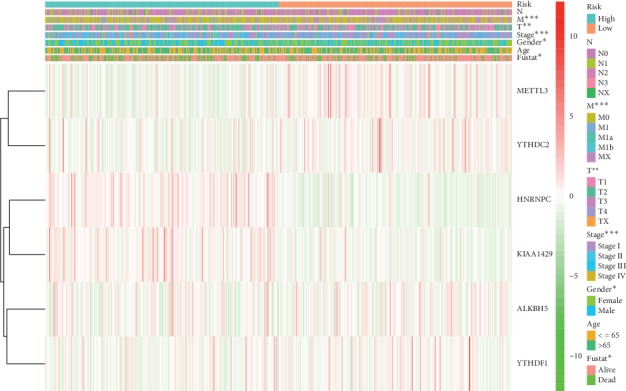
The heatmap of the relationship between the signature and clinical features via the Chi-square test. ∗represents p < 0.05, ∗∗represents p < 0.01, and ∗∗∗represents p < 0.001.

The heatmap of the relationship between the signature and clinical features via the Chi-square test. ∗represents p < 0.05, ∗∗represents p < 0.01, and ∗∗∗represents p < 0.001.