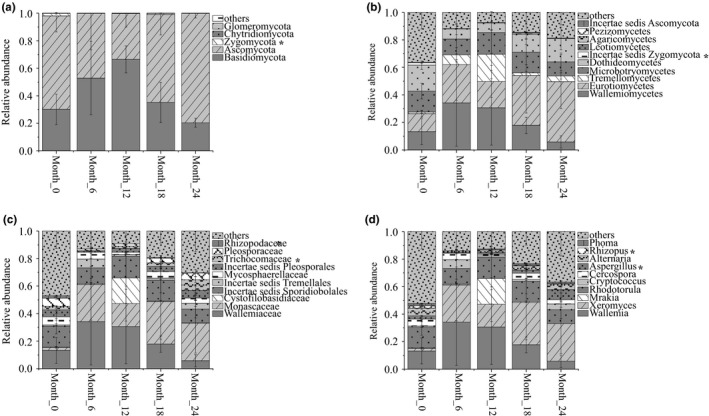
Figure A2.

Composition and dynamics of the top 10 fungal communities at different levels of phylum A, class B, family C and genus D. The relative abundance of the other groups with the exception of the top 10 was assigned as “others”. * indicates a significant change (p value < .05) in relative abundance of the OTU of tobacco during aging process.
