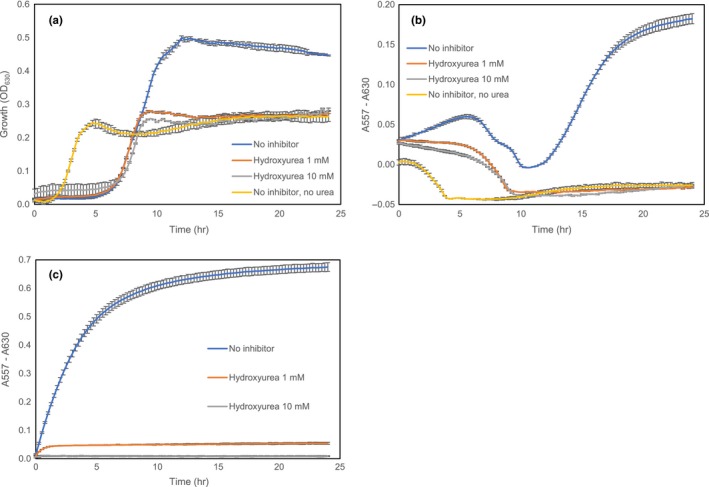
Figure A4.

Effects of hydroxyurea on K. pneumoniae and cell‐free urease in M9U.A: growth curves of K. pneumoniae in M9U with 0 mM, 1 mM, and 10 mM hydroxyurea and one M9U control without hydroxyurea and urea. B: the change in absorbance related to the pH (A557–A630) of K. pneumoniae cultures in M9U with 0 mM, 1 mM, and 10 mM of hydroxyurea and one culture control without hydroxyurea and urea. C: the change in absorbance related to pH (A557–A630) caused by jack bean urease activity in M9U with 0 mM, 1 mM, and 10 mM of hydroxyurea. All curves are the means of triplicates with error bars showing the standard deviation
