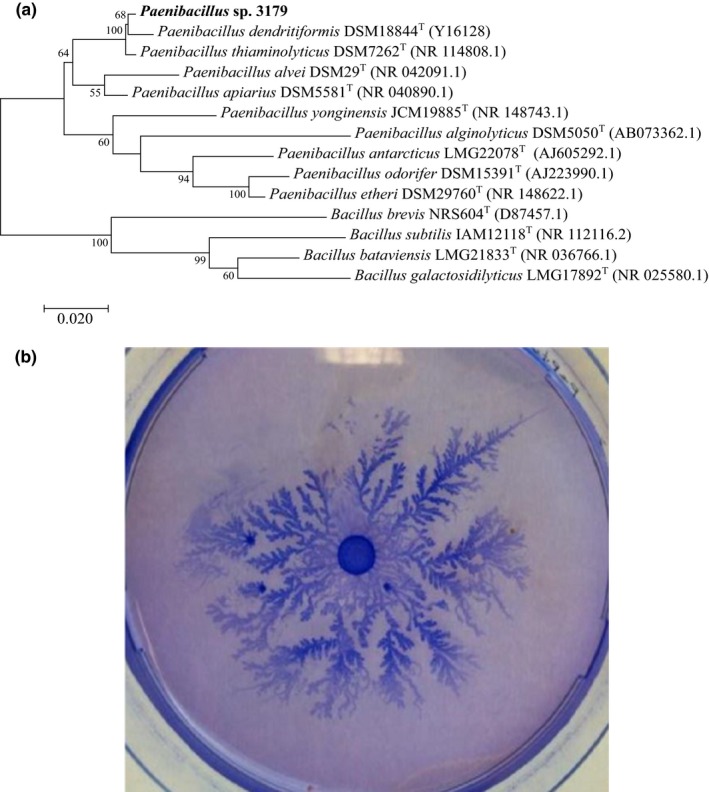
Figure 1.

(a) Phylogeny of 16S rRNA genes generated using the maximum likelihood method based on the Tamura–Nei algorithm, showing the phylogenetic relationships between Paenibacillus sp. 3179 and related taxa. Numbers at nodes are bootstrap values shown as percentages of 100 replicates. (b). Paenibacillus sp. 3,170 cultured at 50°C for 48 hr on agar (0.8% w/v) with peptone (0.2% w/v) and subsequently stained with Coomassie Brilliant Blue and destained in ethanol (20% v/v) and acetic acid (5% v/v)
