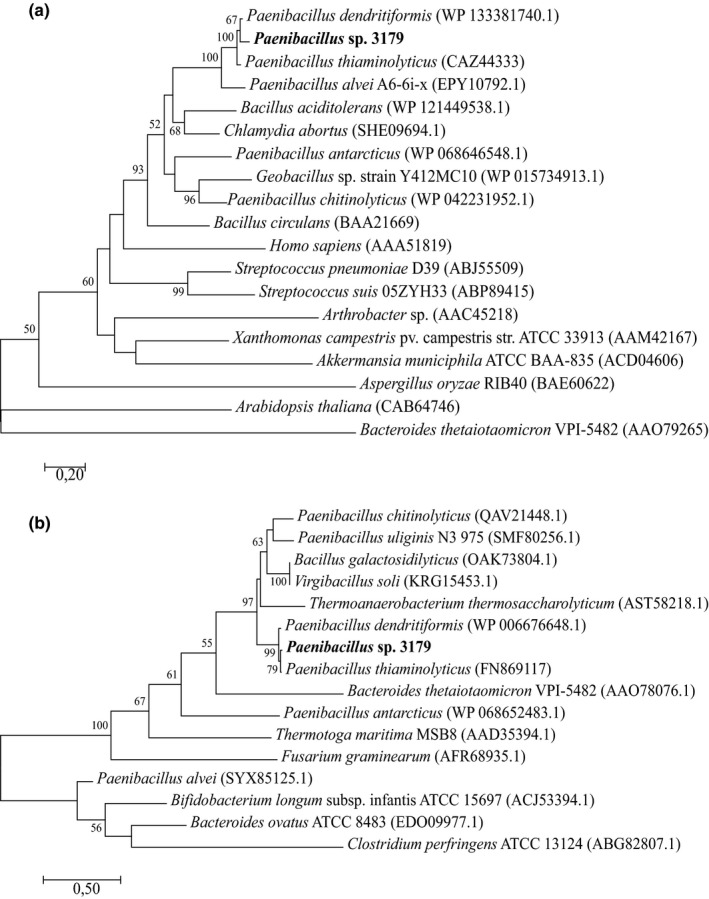
Figure 3.

Phylogenetic analysis of (a) Paenibacillus sp. 3179 β‐d‐galactosidase and (b) Paenibacillus sp. 3179 α‐l‐fucosidase. Sequences that showed similarities to the Paenibacillus sp. 3179 enzymes were identified by BLASTp analysis against Protein Data Bank (PDB) and supplemented with closely related enzymes from the nonredundant (nr) protein sequence database. The latter were only selected if also identified among GH35 and GH29 family enzymes, respectively, in the CAZy database (http://www.cazy.org). Phylogenetic relationships were inferred the by maximum likelihood method based on the JTT matrix‐based model. The trees with the highest log likelihood are shown. Bootstrap values (n = 100) above 50 are shown. All positions containing gaps and missing data were eliminated. Evolutionary analyses were conducted in MEGA7
