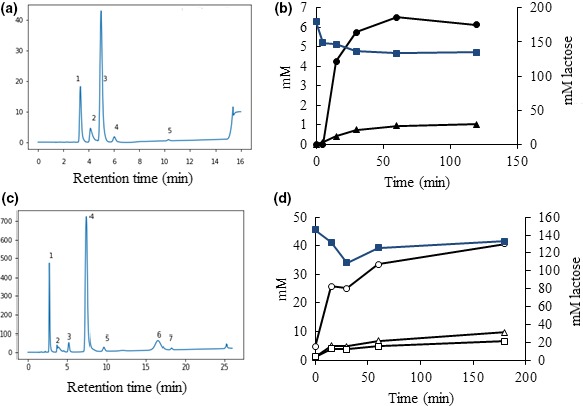
Figure 6.

HPLC analyses of transglycosylation reactions. (a) Transgalactosylation profile after 4 hr with Paenibacillus sp. 3179 β‐d‐galactosidase using lactose as sole substrate. Peaks are identified as follows: 1: glucose and galactose monomers. 2: unidentified (not a part of the reaction, present in all samples). 3: lactose. 4:6’‐O‐galactosyl‐lactose (6‐gal‐lac). 5:3’‐O‐galactosyl‐lactose (3‐gal‐lac). After 120 min, 24% of the lactose has been converted and results in 0.14 mol/mol 6‐gal‐lac and 0.027 mol/mol 3‐gal‐lac. (b) Diagram showing the utilization of lactose (blue squares, secondary axis) and production of 6‐gal‐lac (black circles, primary axis) and 3‐gal‐lac (black triangles, primary axis) over time (120 min.). (c) Transfucosylation profile after 3 hr with Paenibacillus sp. 3179 α‐l‐fucosidase using pNP‐fucose as donor and lactose as acceptor. Peaks are identified as follows: 1: fucose. 2: unidentified (not a part of the reaction, present in all samples). 3: product of the reaction with increasing concentration over reaction time and a relative elution to 2FL and lactose corresponding retention of 3FL. 4: lactose. 5:2’‐O‐fucosyllactose (2FL). 6 and 7: unidentified. (d) Diagram showing utilization of lactose (blue squares, secondary axis) and production of monomeric fucose (open circles, primary axis), 2FL (open squares, primary axis), and the compound with retention corresponding to 3FL (peak 3 in panel C) (open triangles, primary axis) over time (180 min.)
