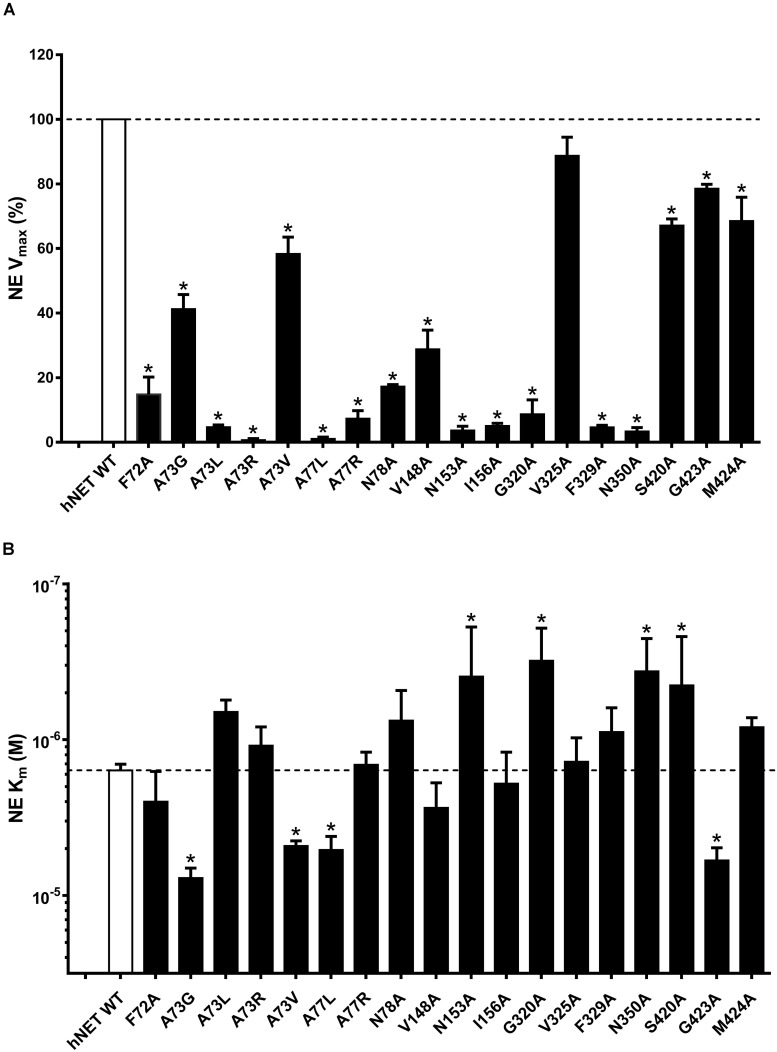
FIGURE 8.
Effect of hNET mutants on NE uptake. Comparison of WT and hNET mutants (A) Vmax and (B) Km for NE determined from saturation uptake curves, where non-specific uptake was determined in the presence of 200 μM NX. Values are means ± SEM of 3–4 separate experiments for mutants and n = 15 for WT, each performed in triplicate. *Significant mutant effects compared with WT hNET, analyzed by Dunnett’s multiple comparisons test after one-way ANOVA.

