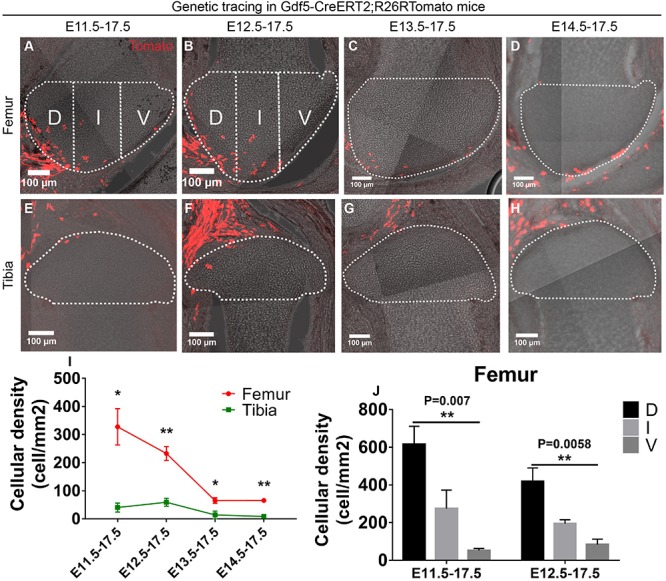
FIGURE 1.

Gdf5-expressing cells contribute asymmetrically to the epiphyseal cartilage development. (A–H) Example images showing the distribution of traced Gdf5-expressing cells in the epiphyseal cartilage of knee joint. D, I, and V refer to dorsal condyle, intercondylar eminence and ventral condyle regions, respectively. (I) Quantification of the cellular density distribution among the four tracing periods revealed an asymmetrical contribution of the Gdf5-expressing cells to the epiphyseal cartilage of femur and tibia. (J) Quantification of the cellular density distribution in the D, I, and V regions during E11.5–E17.5 and E12.5–E17.5 tracings revealed an asymmetrical contribution of the Gdf5-expressing cells to the femoral epiphyseal cartilage along the dorsal-ventral axis. Clonal density represents the number of traced clones over cartilage area (mm2). Data represent mean ± SEM, where at least five embryos were analyzed. The white dashed lines outline the epiphyseal cartilage in (A–H). *P < 0.05, **P < 0.01.
