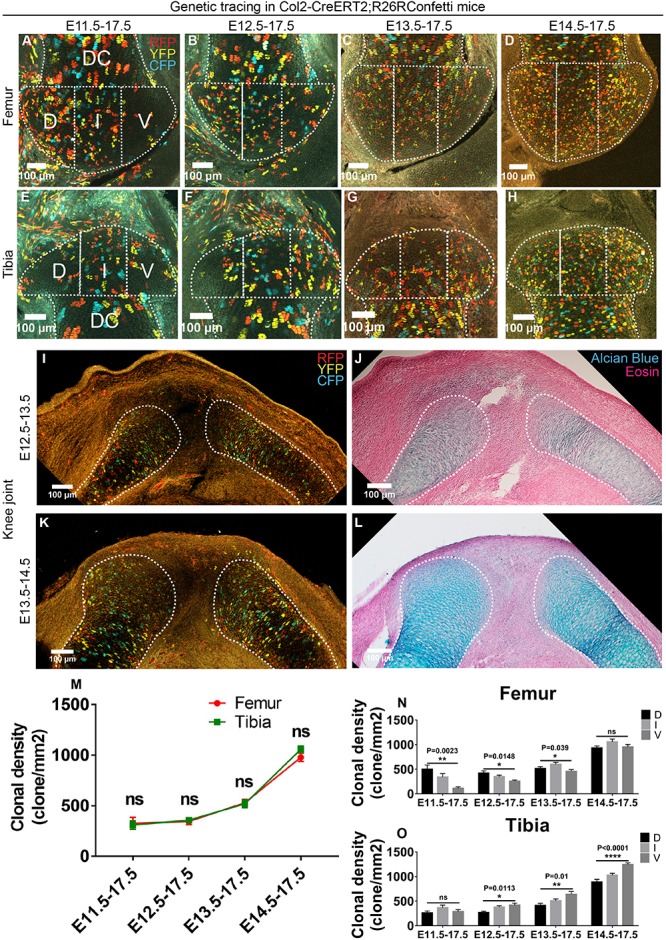
FIGURE 2.

Cells in the cartilaginous anlagen are the major contributors to epiphyseal cartilage development in an asymmetrical manner. (A–H) Example images illustrating the distribution of traced Col2-expressing clones in the epiphyseal cartilage of knee joint. D, I, and V refer to dorsal condyle, intercondylar eminence, and ventral condyle regions, respectively. (I–L) 1-day tracings of the Col2-expressing cells from E12.5 to E13.5 and E13.5 to E14.5 mainly labeled the cells in the diaphyseal side of the cartilaginous anlagen. (J) and (L) are alcian blue and eosin staining of the same tissue section on the left. (M) Quantification of the clonal density distribution revealed an ascending trend in the epiphyseal cartilage among the four tracing periods. (N,O) Quantification of the clonal density distribution in the D, I, and V regions revealed an asymmetrical contribution of the Col2-expressing clones to the femoral and tibial epiphyseal cartilage along the dorsal-ventral axis during many of the analyzed tracing periods. Clonal density represents the number of traced clones over cartilage area (mm2). Data represent mean ± SEM, where at least five embryos were analyzed. The white dashed lines outline the epiphyseal and diaphyseal cartilage (DC). *P < 0.05, **P < 0.01, ****P < 0.001, ns, not significant.
