FIGURE 4.
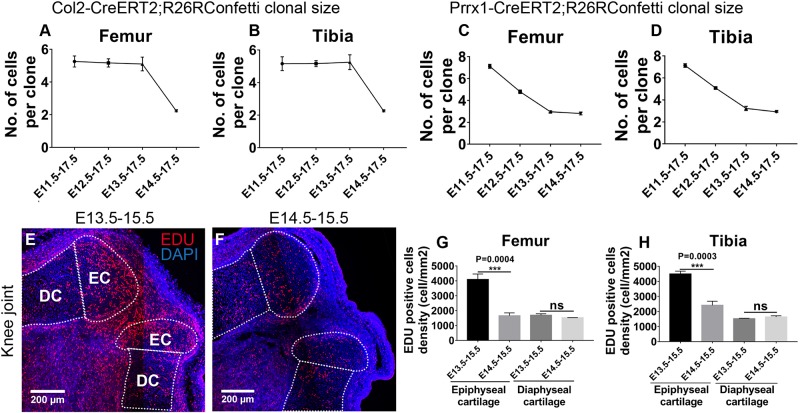
Epiphyseal cartilage formation involves influx of Col2-expressing cells post joint cavitation. (A,B) Size of the traced Col2-expressing clones was significantly reduced in the femoral and tibial epiphyseal cartilage during E14.5–E17.5 tracing. (C,D) Size of the traced Prrx1-expressing clones gradually decreased as the tracing was initiated at later stages. (E,F) Example EDU staining images of knee joint in wild type mice injected with EDU at E13.5 or E14.5. (G,H) More EDU-positive cells were found in the epiphyseal cartilage, but not the underneath growth plate, of both femur and tibia when EDU was injected at E13.5 compared to injection at E14.5. EDU-positive cell density represents the number of EDU-positive cells over cartilage area (mm2). Data represent mean ± SEM, where at least three embryos were analyzed. The white dashed lines outline the epiphyseal cartilage (EC) and diaphyseal cartilage (DC). ***P < 0.005, ns, not significant.

